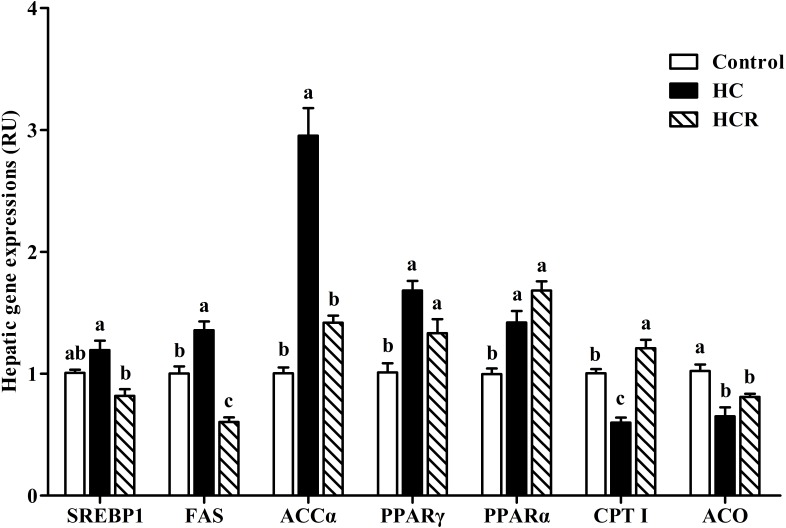
FIGURE 5.
Relative expressions of the genes involved in lipid metabolism in the liver of blunt snout bream fed different experimental diets. Data are referred to the values (relative units, RU) obtained in fish fed the control diet. Values were normalized with the transcription of EF1α. Each data represents the mean of four replicates. Bars assigned with different letters are significantly different (P < 0.05). Control, diet with 30% carbohydrate level; HC, diet with 41% carbohydrate level; HCR, diet with 41% carbohydrate and 0.04% resveratrol.

