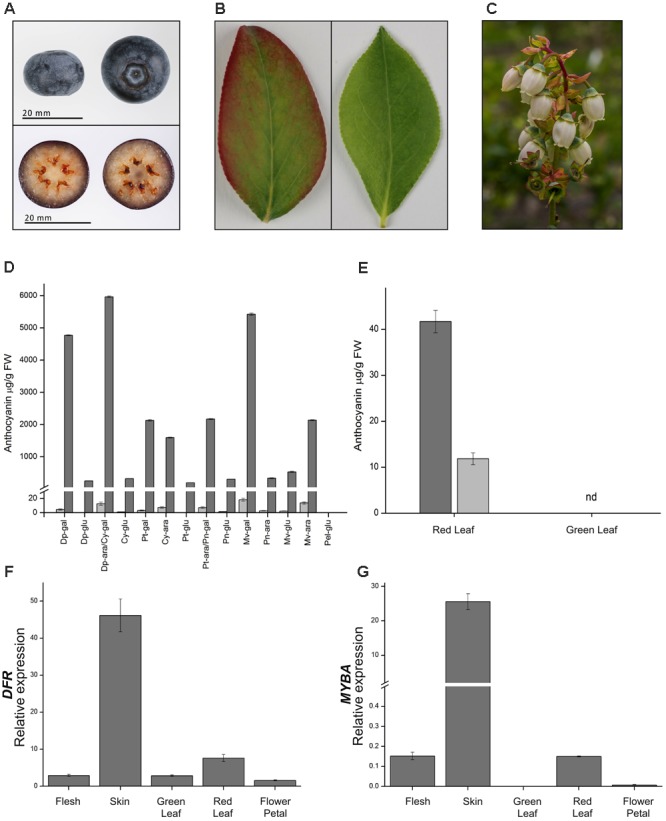
FIGURE 5.

Anthocyanin accumulation and gene expression in blueberry fruits, leaves, and flowers. (A) Representative berry as used at mature stage. (B) Representative leaves at the same developmental stage showing presence (left) or absence (right) of anthocyanin pigmentation. (C) Flowers showing little, if any, anthocyanin. (D) Anthocyanin composition and concentration for fruit flesh (light gray bars) and skin (dark gray bars). Cy, cyanidin; Pn, peonidin; Dp, delphinidin; Pt, petunidin; Mv, malvidin; ara, arabinoside; gal, galactoside; glu, glucoside; nd, not detectable. Compounds Dp-ara/Cy-gal and Pt-ara/Pn-gal were not distinguishable at the resolution used for this analysis. (E) Anthocyanin composition in red and green leaves, cyanidin 3-galactoside (dark gray bars), and cyanidin 3-O-glucoside (light gray bars). Relative gene expression of (F) DFR or (G) MYBA in fruit flesh and skin, green and red leaves, and flower petals. Mean of three biological replicates. Error bars represent ± SEM. Rabbiteye and highbush blueberry used for A/B and C, respectively.
