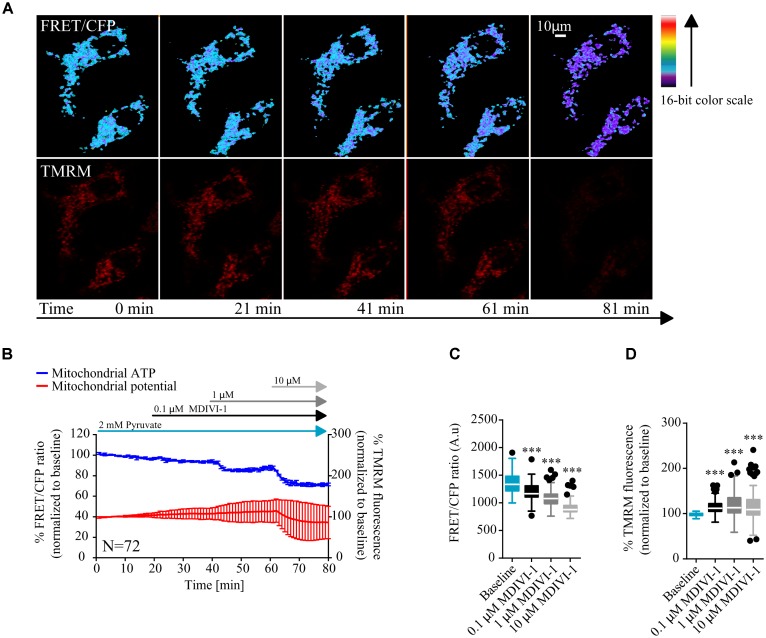
FIGURE 1.
MDIVI-1 treatment decrease mitochondrial ATP production. (A) Representative images of the FRET/CFP ratio in MCF7 cells transfected with the mito ATeam FRET probe in MDIVI-1 titration experiments. TMRM was used to measure mitochondrial membrane potential changes. (B) Mitochondrial ATP and membrane potential kinetics in MCF7 during MDIVI-1 titration. FRET/CFP ratio and TMRM fluorescence kinetics were recorded simultaneously. Baseline was recorded for 20 min, after which 0.1, 1, and 10 μM of MDIVI-1 was added to the medium with intervals of 20 min. All data represent mean ± SD from n = 3 independent experiments and both signals are normalized to the baseline levels. (C) The absolute FRET/CFP ratio was analyzed by taking the minimal value reached by the probe in each cell after each MDIVI-1 addition into account. Values were evaluated by one-way ANOVA with Tukey post-test for multiple comparison (∗ indicates a p-value < 0.05, ∗∗ indicates a p-value < 0.01, and ∗∗∗ indicates a p-value < 0.001). (D) TMRM intensity values, normalized to the baseline levels, were analyzed by taking the maximal value reached during MDIVI treatments into account and statistical analysis was performed as described in (C).

