FIGURE 4.
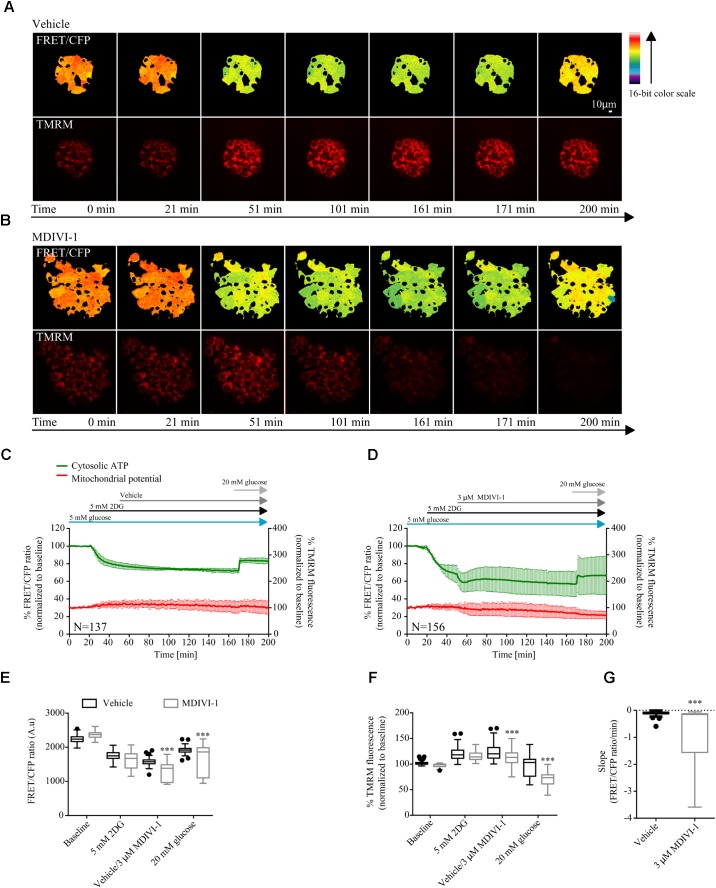
Combination treatment of 2DG with MDIVI-1 decrease ATP bioenergetics. (A,B) Representative images for FRET/CFP ratio from cytosolic ATP FRET probe and TMRM for vehicle and MDIVI-1 in combination with 2DG, respectively. (C,D) Cytosolic ATP and membrane potential traces in MCF7 during vehicle and MDIVI-1 treatment in combination with 2DG, respectively. FRET/CFP ratio kinetics and TMRM fluorescence were recorded simultaneously in MCF7 cells. Cells were placed in KB with 5 mM glucose and baseline was recorded for 20 min, after which 5 mM 2DG was added to the medium. After 30 min vehicle or 3 μM MDIVI-1 was added. After recording of the signal for 2 h 20 mM glucose was added for 30 min. All data represent mean ± SD from n = 3 independent experiments and both signals are normalized to the baseline levels. (E) The absolute FRET/CFP ratio was analyzed by taking the minimal value reached by the probe in each cell after 2DG and MDIVI-1 addition and the maximal value after 20 mM glucose treatment into account. Values were evaluated by one-way ANOVA with Tukey post-test for multiple comparison (∗ indicates a p-value < 0.05, ∗∗ indicates a p-value < 0.01 and ∗∗∗ indicates a p-value < 0.001). (F) TMRM intensity values, normalized to the baseline levels, were analyzed by taking the max and min values after each treatment into account and statistical analysis was performed as described in (E). (G) Slope values were assessed by dividing the minimal FRET/CFP ratio to the Δtime (time offset – time onset). Values were analyzed using Mann-Whitney test to show significance (∗∗∗ indicates a p-value < 0.001).

