Figure 2.
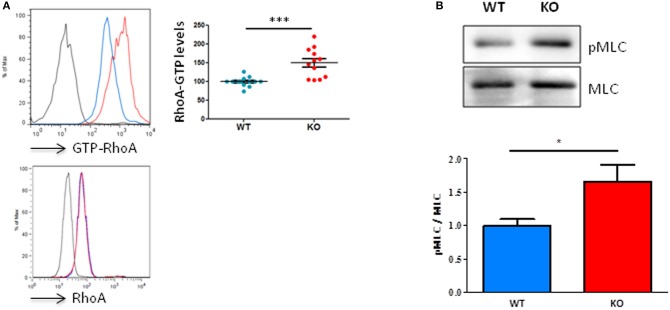
Fam65b KO T cells exhibit an exacerbated RhoA signaling pathway. (A) Top left panel: Example of detection of the amount of RhoA-GTP by flow cytometry in lymph node T lymphocytes from WT (blue) or Fam65b KO (red) mice. Top right panel: RhoA-GTP levels from eight independent experiments are shown. The intensity of the RhoA-GTP staining obtained in each experiment is normalized to the average values of WT mice. Bottom panel: The detection of the total amount of RhoA in T cells shown by flow cytometry shows no difference between WT and Fam65b KO mice. (B) Top: After purification of T lymphocytes from WT or Fam65b KO mice, expression of phospho-MLC (pMLC) and total MLC was analyzed by Western blot. Bottom: Quantification of the pMLC/MLC ratio measured in three independent experiments. *p < 0.05, ***p < 0.001.

