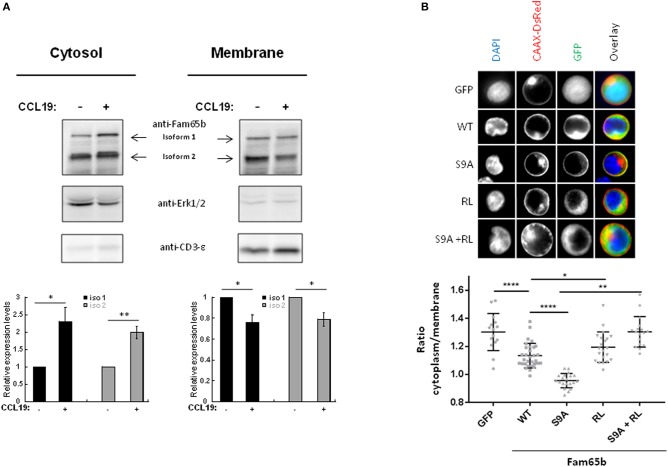
Figure 4.
Phosphorylation controls Fam65b shuttling between the plasma membrane and the cytosol. (A) Top: PBTs were stimulated or not with 200 ng/ml CCL19 for 2 min before performing a cell fractionation assay. The obtained cytosolic and membranous fractions were then analyzed by Western blot using an anti-Fam65b antibody as well as the following antibodies directed against: Erk1/2 and CD3-ε used as specific markers for the cytosol and the membranes, respectively. Bottom: Quantification of the levels of expression of Fam65b isoforms 1 and 2 after normalization to controls of each compartment for each time condition (means ± SE from five independent experiments). (B) Top: CEM cells were transfected with the GFP expression vector alone, Fam65b-GFP WT, Fam65b(S9A)-GFP, the non-RhoA binding mutant Fam65b(RL)-GFP or the double mutant Fam65b(S9A, RL)-GFP together with pCAAX-DsRed to stain the plasma membrane in red. These cells were then labeled with DAPI (blue) to stain the nucleus. The fluorescence microscopy images shown were randomly acquired at 60X magnification. Bottom: Quantification of GFP intensity in the cytoplasm/plasma membrane of CEM cells. Each symbol corresponds to the analysis of one cell. A total of 15–35 cells per transfection condition were included in this quantification. *p < 0.05, **p < 0.01, ****p < 0.0001.

