Figure 2.
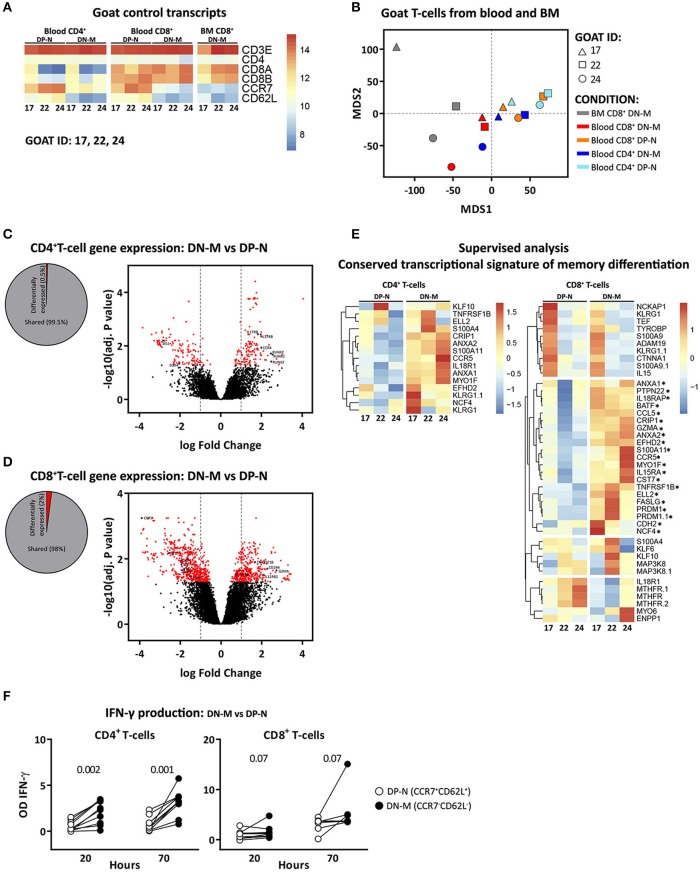
CCR7−CD62L− (DN-M) T-cells present transcriptional and functional characteristics of memory T-cells. Microarray profiling was performed on DN-M (CCR7−CD62L−) and DP-N (CCR7+CD62L+) CD4+ and CD8+ T-cells from blood and DN-M CD8+ T-cells from BM of 3 goats (goat 17, 22, and 24). (A) Heatmap showing normalized expression levels of control genes, CD3E, CD4, CD8A, CD8B, CCR7, and CD62L for all the samples. (B) Multidimensional scaling (MDS) of DN-M and DP-N samples from blood and BM for CD4+ and CD8+ T-cell subsets, based on the global transcriptome (~47,151 probes). (C,D) Diagram showing the percentage significantly differentially expressed genes (adjusted p-value (BH) < 0.05) between DN-M and DP-N CD4+ (C) or CD8+ (D) T-cells from blood, as well as volcano plots illustrating the log2 fold change differences in gene expression levels between DN-M and DP-N CD4+ (C) or CD8+ (D) T-cells from blood. Significantly differentially expressed genes (adjusted p-value (BH) < 0.05) are shown in red, blue dots depict genes related to memory differentiation. (E) Heatmap showing the normalized expression of genes from the adaptive memory signature (33) in CD4+ T-cells (left panel); and of genes from the conserved CD8 memory signature (33) in CD8+ T-cells (right panel). Genes up-regulated in DN-M compared to DP-N CD8+ T-cells in the 3 different goats are marked with an*. Gene expression is scaled per row. (F) DN-M (CCR7−CD62L−) and DP-N (CCR7+CD62L+) CD4+ and CD8+ T-cells sorted from blood were cultured in vitro for 70 h in the presence of PMA/ionomycin. Mean IFN-γ production, measured from the supernatant by ELISA, at 20 and 70 h after stimulation is shown as the OD of stimulated samples minus the OD of the background (unstimulated sample). P-values obtained using the Wilcoxon signed-rank test are shown.

