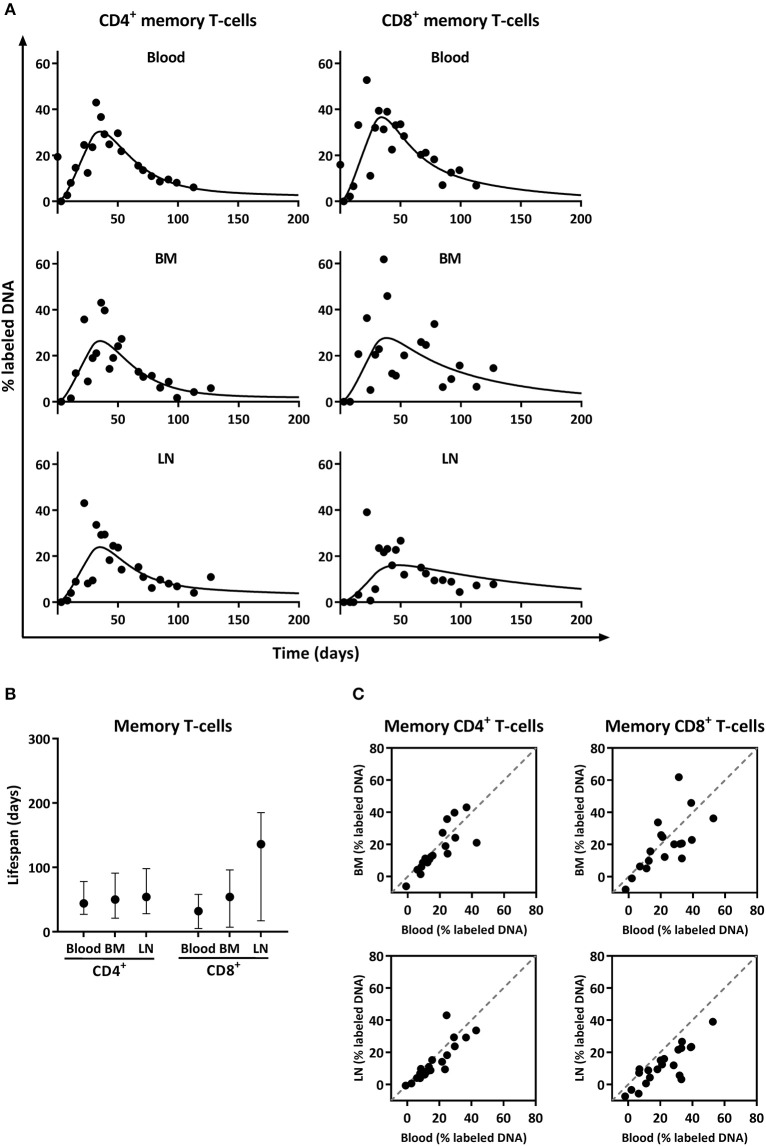
Figure 4.
Analysis of deuterium enrichment and summary of the estimated lifespan of CD4+ and CD8+ memory T-cells from blood, BM and LN. (A) Best fits to the level of deuterium enrichment measured in the DNA of CD4+ and CD8+ memory (CCR7−) T-cells from blood, BM and LN. Label enrichment in the DNA was scaled between 0 and 100% by normalizing to the maximum enrichment in granulocytes (See material and methods). (B) Estimated lifespans of CD4+ and CD8+ memory T-cells in days, and their respective 95% confidence limits. (C) Correlation between deuterium enrichment in BM and blood, and LN and blood. The gray dashed line represents the X = Y line.

