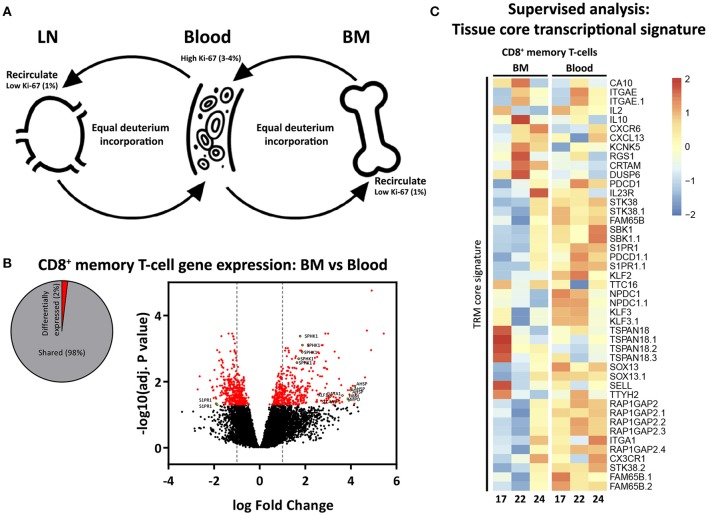
Figure 5.
Proposed model of proliferation and recirculation. (A) Memory T-cells from BM and LN have a lower fraction of Ki-67 positive cells compared to memory T-cells from blood, but similar deuterium incorporation. We here propose a dynamic model in which memory T-cells are continuously recirculating between BM, blood, and LN. If BM memory T-cells would compose a separate population of resting and resident cells, one would expect to find low percentages of Ki-67 as well as low deuterium incorporation in BM. The fact that memory T-cells isolated from the BM had substantial levels of deuterium enrichment in the DNA shows that memory T-cells from BM do proliferate. The fact that the percentage of Ki-67 positive cells in BM was lower compared to blood while deuterium enrichment curves were very similar strongly suggests that memory T-cells are recirculating. Because of the difficulties in the interpretation of Ki-67 expression (see discussion) it remains unclear where the divisions occur. (B) Diagram showing the percentage significantly differentially expressed genes (adjusted p-value (BH) < 0.05) between BM and blood memory (CCR7−) CD8+ T-cells, as well as a volcano plot illustrating the log2 fold change differences in gene expression. Significantly differentially expressed genes are shown in red, yellow dots depict tissue related genes. (C) Heatmap showing normalized expression levels of genes defining the tissue resident memory (TRM) core transcriptional signature (42). Gene expression is scaled per row.

