
FIGURE 5.
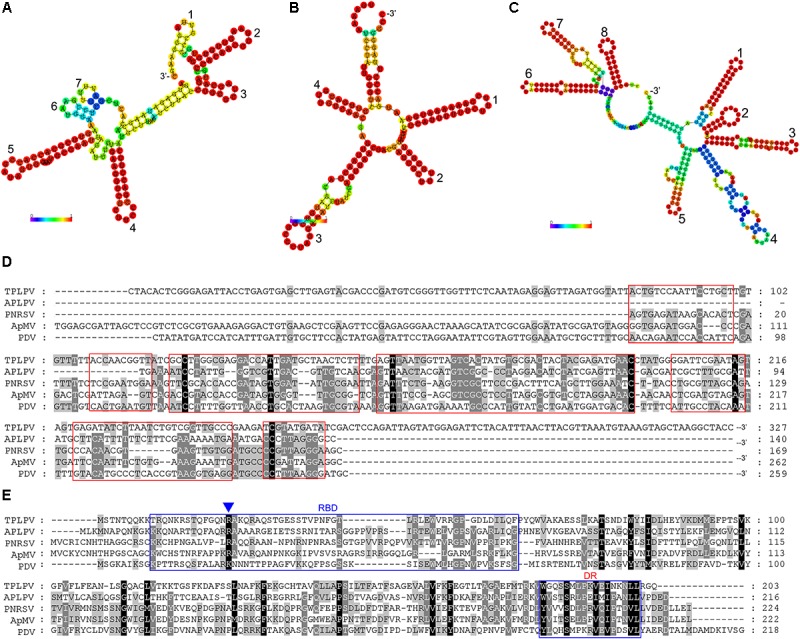
Secondary structure comparison (A–C), alignment analysis of the 3′ untranslated region (3′UTR) of TPLPV (D) and alignment analysis of TPLPV coat protein (E) with related ilarviruses. (A–C), Minimum free energy plain structure drawings of the 3′UTR of the PNRSV RNA3, American plum line pattern virus (APLPV) RNA3 and TPLPV RNA3, respectively. Stem-loop structures in each drawing are denoted from 3′ terminus (digits). Bars indicate the base pair probabilities. (D), Alignment of the RNA3 3′UTR of TPLPV, APLPV, PNRSV, ApMV, and PDV. The red boxes indicate the corresponding regions of seven stem-loop structures in (A). (E), Alignment of the coat protein of TPLPV, APLPV, PNRSV, ApMV, and PDV. Putative RNA binding domain (RBD) and dimerization region (DR) in the coat proteins are indicated using blue boxes. The R residue in RBD was marked by a blue triangle (Δ), which is essential for the binding to the RNA.