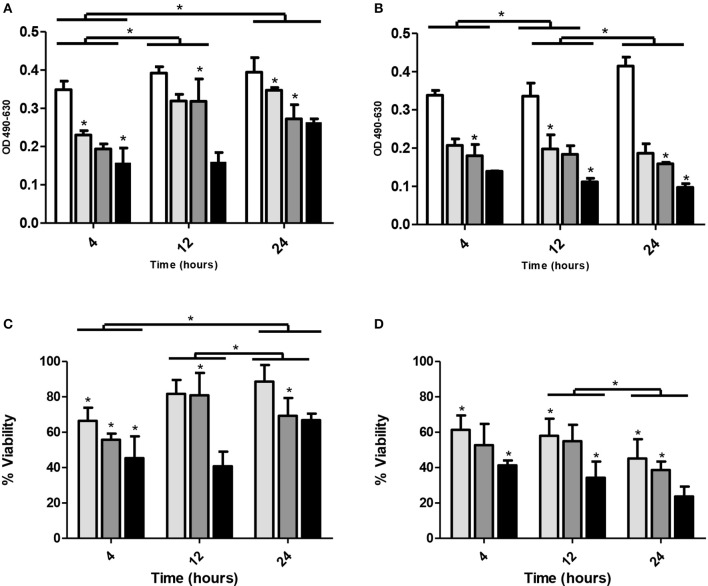
Figure 4.
Phage treatments of K. pneumoniae KP/01 biofilms. Panels (A) and (B) show the effect of phage treatment on preformed biofilms determined by crystal violet staining and solubilization estimates of biomass: (A) single treatment with phage ZCKP1; (B) with multiple treatments with phage ZCKP1 using different MOIs. White columns represent untreated control; light gray columns represent a starting MOI of 5; dark gray columns represent a starting MOI of 10 and solid black columns represent a starting MOI of 50. Panels (C) and (D) show bacterial counts in biofilms determined using an MTT assay, (C) single treatment with phage ZCKP1 bacteriophage or (D) with multiple treatments with phage ZCKP1 bacteriophage using different MOIs: Light gray columns represent a starting MOI of 50; dark gray columns represent a starting MOI of 10 and solid black columns represent a starting MOI of 5. *P < 0.01 (brackets specify comparisons between groups).

