FIGURE 4.

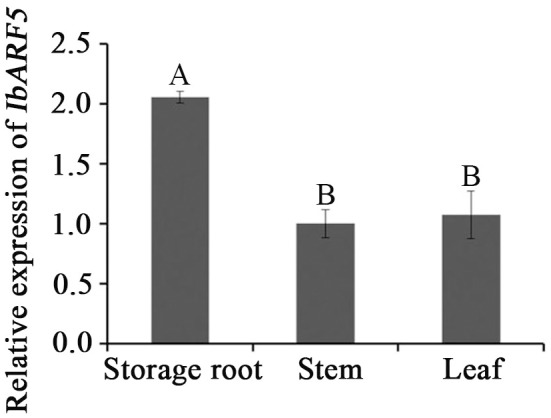
Expression analysis of IbARF5 in storage root, stem, and leaf tissues of HVB-3. Data are presented as means ± SE (n = 3). Different capital letters indicate a significant difference at P < 0.01 by Student’s t-test.

Expression analysis of IbARF5 in storage root, stem, and leaf tissues of HVB-3. Data are presented as means ± SE (n = 3). Different capital letters indicate a significant difference at P < 0.01 by Student’s t-test.