
Fig. 2.
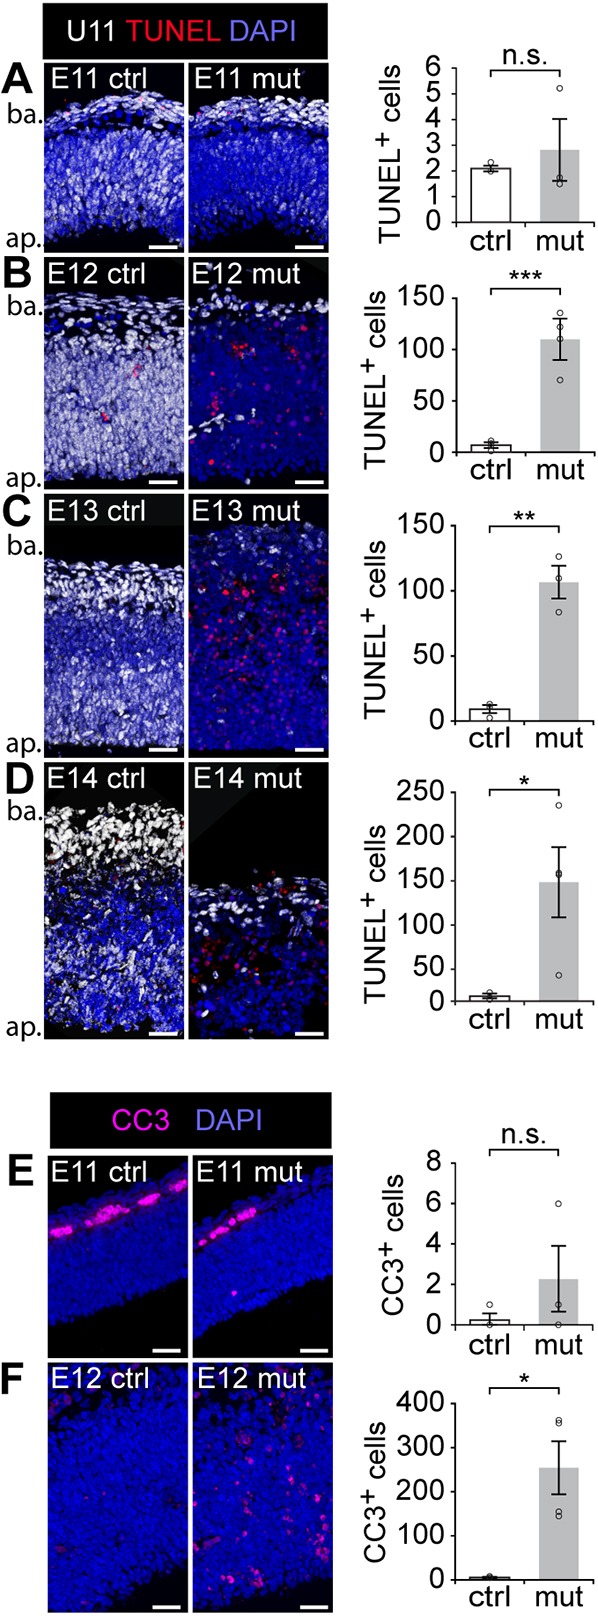
Cell death contributes to microcephaly in the U11 cKO mice. (A-E) Fluorescent ISH (FISH) signal for U11 (white) combined with TUNEL (red) on control (ctrl, left) and mutant (mut, middle) pallium sections from E11 (A), E12 (B), E13 (C) and E14 (D) embryos, with quantification of TUNEL+ cells (right). Ap, apical; ba, basal. (E,F) IF for cleaved caspase 3 (CC3) in ctrl (left) and mut (middle) pallium sections from E11 (E) and E12 (F) embryos, with quantification of CC3+ cells (right). Scale bars: 30 µm. Data are presented as mean±s.e.m. For details of statistical methods, see Table S8. n.s., not significant; *P<0.05; **P<0.01; ***P<0.001.