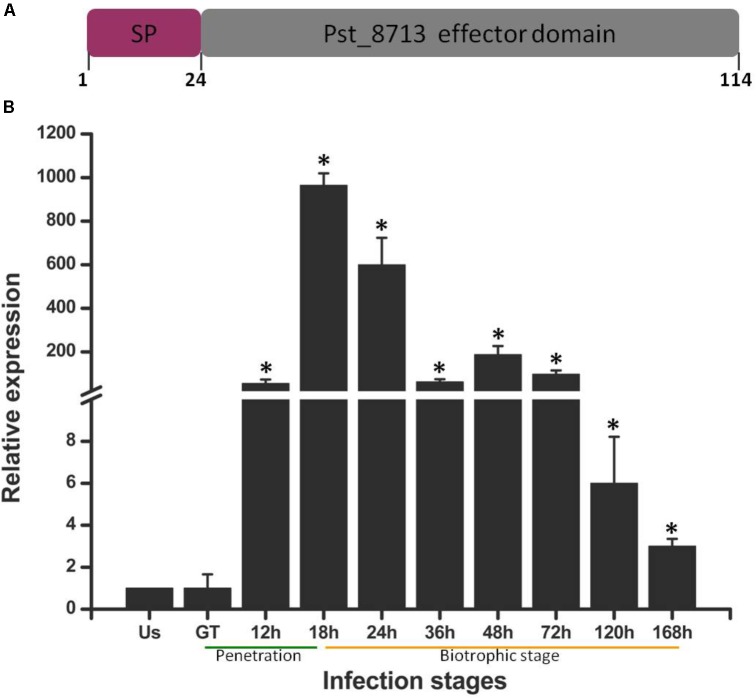
FIGURE 1.
Pst_8713 is significantly up-regulated during Pst-infection of wheat. (A) The primary structure of Pst_8713. SP, signal peptide. (B) Transcript levels of Pst_8713 at various stages of Pst infection. US, Urediniospores; GT, Germinated tube of US, 12–168 h, wheat leaves infected with Pst at 18–168 hpi. The relative gene quantification was calculated by the comparative Ct method with Pst endogenous gene EF1 as an internal standard and was relative to that of US. Bars indicate means of three independent biological replicates (±SE). Asterisks indicate significant differences (P < 0.01) relative to the US sample determined using Student’s t-test.

