Figure 4.
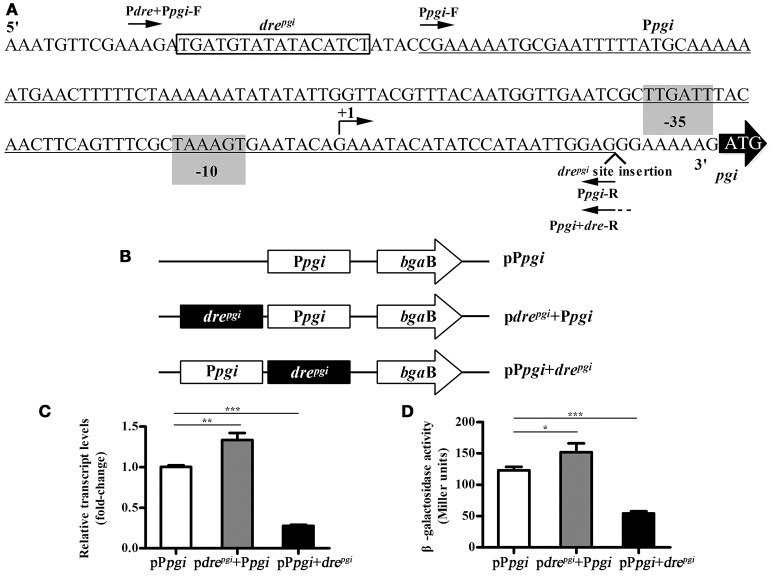
Influence of the relative position of the promoter and the dre site in pgi gene. (A) Binding site of NagRBt and promoter in the upstream region of pgi gene. The putative−35 and−10 positions (predicted by Neural Network Promoter Prediction, http://www.fruitfly.org/seq_tools/promoter.html, score 0.94) are shaded. The corresponding predicted +1 is indicated by a bent arrow and the dre site is boxed. The pgi promoter region (underlined) was amplified with primers (Ppgi-F and Ppgi-R). The fragment with the dre site before the promoter (i.e., native configuration) was amplified with primers (Pdre+Ppgi-F and Ppgi-R) and the fragment with dre site after the promoter with primers (Ppgi-F and Ppgi+dre-R). (B) Schematic diagram of the change in the relative position with promoter and dre site. (C) qRT-PCR was used to examine the expression of bgaB in three plasmids (pdrepgi+Ppgi, pPpgi+drepgi, and pPpgi) in wild-type strain Bti75. (D) β-galactosidase activity assay of three plasmids (pdrepgi+Ppgi, pPpgi+drepgi, and pPpgi) in wild-type strain Bti75. Significance was calculated by two-sample t-test (*p < 0.05, **p < 0.01, and ***p < 0.001).

