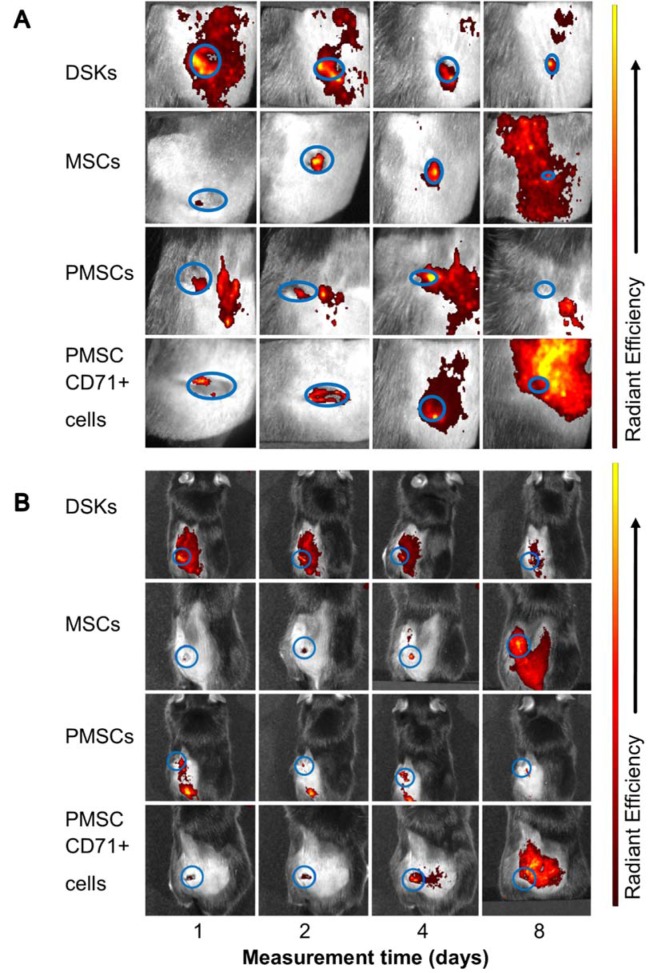
Figure 8. Visualisation of intravenously injected cells migration and accumulation in the C57BL/6J mouse. Images of MitoTracker Deep Red labelled cells in the same animal were taken on 1st, 2nd, 4th and 8th day after transplantation.
A. The presence of dorsal skin keratinocytes (DSKs), mesenchymal stromal cells (MSCs), partially differentiated MSCs (PMSCs) and CD71 positive PMSC population (PMSC_CD71+ cells in the wound area
B. The presence of DSKs, MSCs, PMSCs, PMSC_CD71+ cells in the region of interest (ROI). Fluorescence intensity normalised to the first measurement. Error bars indicating standard deviation. n = 6 mice

