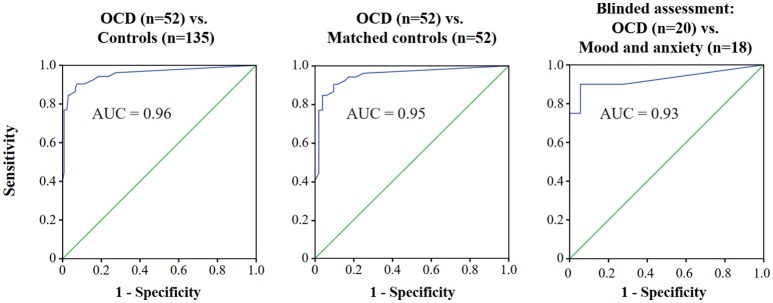
Figure 2.
ROC curves for use of the Y-BOCS-II to identify OCD. Plot of the true positive rate (1—specificity) against the false positive rate (sensitivity) for the different possible cut-offs of the Y-BOCS-II using the SCID-OCD as the diagnostic instrument. In the left panel, all participants were considered. In the middle panel, OCD and age-, gender-, and education-matched controls (balanced mixture of healthy subjects and patients with mood and anxiety disorders) are considered. In the right panel, patients who completed a blinded assessment are considered. ROC, Receiver operating characteristic; Y-BOCS-II, Yale-Brown Obsessive-Compulsive Scale-II; OCD, Obsessive-compulsive disorder; AUC, Area under the curve.

