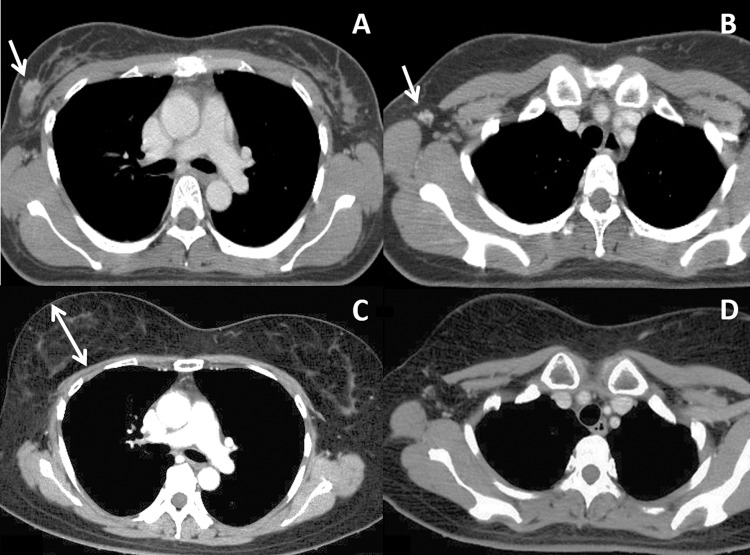
Figure 2.
Computed tomography (CT) images of a patient before and 5 years after treatment. A and B, Before treatment. Arrows indicate a mammary tumor (A) and an axillary lymph node (B). C and D, Five years after treatment, both the breast tumor and axillary lymph node are controlled. Note the marked enlargement of the right irradiated breast. The double-headed arrow in Figure 2C indicates the breast height on CT defined in this study.

