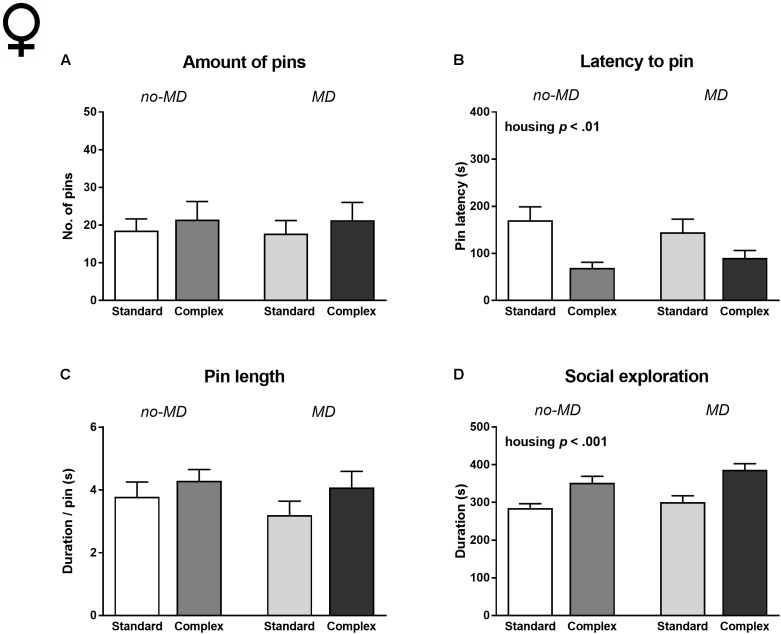
FIGURE 3.
Female adolescent social play behavior following 24 h of social isolation in MD and complex housed rats. (A) Total amount of pins, (B) latency to pin, (C) pin length, and (D) time spent in social exploration. Statistics depict main effects. Graphs represent mean + SEM. Group sizes: no-MD standard housing n = 13, no-MD complex housing n = 13, MD standard housing n = 13, MD complex housing n = 12 couples.

