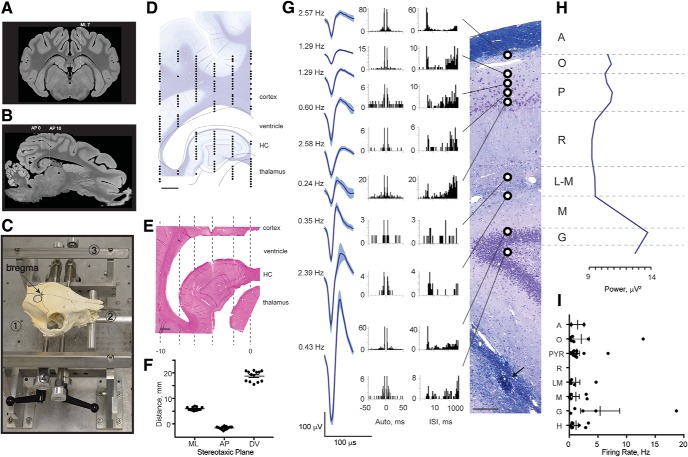
Figure 2.
Single-unit recordings in porcine hippocampus corroborate laminar structure. A, A representative coronal section from the MRI atlas (bregma –1.5 mm) within the 12-mm AP range of interest shows the orientation of deep structures such as dorsal and ventral hippocampi (Saikali et al., 2010). We selected ML 7 as an access plane to the widest part of dorsal hippocampus. B, A sagittal section through ML 7 taken from the MRI atlas shows position and approximate size of the dorsal hippocampus. The image was rotated so that cortex above hippocampus is in the horizontal plane (horizontal dashed line). An approximate size of the hippocampus is shown between vertical dashed lines from right (AP 0) to left (AP –10). C, Photograph of a pig skull in situ in the novel stereotaxic instrument with an arrow pointing to bregma and a circle indicating a craniectomy site. The main parts of the stereotaxis are frame base (1), bite bar (2), anterior-posterior (AP) bars (3), and pins (4). The animal’s head is first guided between AP bars and onto an adjustable bite bar, then a set of four pins is inserted into the zygomatic bones. Location and size of the craniectomy are shown (black circle). D, ML coordinates obtained with this stereotaxis are fairly accurate, but AP coordinates are not. Therefore, electrophysiological mapping is needed for each experiment. The digitized tungsten map from our initial animal is shown in the AP plane at ML 7 overlying a representative sagittal section, stained with LFB/CV (scale bar = 2 mm). The lines outline deep brain structures including subcortical white matter, ventricle, hippocampus, and thalamus. E, A representative sagittal section from the initial animal stained with H&E (scale bar = 1 mm) contains Hamilton syringe tracks in the AP plane in 2-mm steps from AP 0 to AP –10 (dashed lines). F, The precision and reproducibility of our targeting technique in 13 animals was estimated histologically in the ML and AP planes and electrophysiologically in the DV plane. The estimated distances are (in mm): ML = 5.91 ± 0.17 from midline, AP = –1.60 ± 0.16 from bregma, and DV = 18.76 ± 0.57 (mean ± SEM, n = 13) from brain surface to first multiunit activity. G–I, Example of single spiking activity during the mapping procedure performed by slowly advancing a tungsten electrode along the indicated track. G, A coronal section of the dorsal hippocampus stained with LFB/CV is shown from a subsequent animal from which tungsten electrode recordings were made during the initial mapping procedure (scale bar = 100 μm). Arrow points to the subsequently inserted silicon probe artifact. Histologically identified layers are labeled: alveus (A), stratum oriens (O), stratum pyramidale (P), stratum radiatum (R), stratum lacunosum-moleculare (L-M), stratum moleculare (M), stratum granulosum (G). Three-minute recordings were made at regular intervals spaced 100–200 μm apart. Raw neural signals were processed offline, and putative single units were isolated. Depths at which single units were successfully isolated are indicated by black and white circles. Representative single units from each hippocampal layer are shown as averaged waveforms (mean ± SD) accompanied by firing rates, autocorrelograms, and interspike interval histograms (Robertson et al., 2014). H, To capture all multiunit activity and confirm the locations of the cellular layers, the RMS power of the high-frequency bandpass filtered signal (600–6000 Hz) was calculated. A representative profile of spiking activity shows several peaks at the corresponding pyramidal and granular cell layers. I, Firing rates of single units recorded in 2 animals with tungsten electrodes were averaged within each of 8 layers spanning ∼200 μm each, corresponding to the hippocampal layers calculated in Fig. 1C (mean ± SEM, n = 2).

