Figure 3.
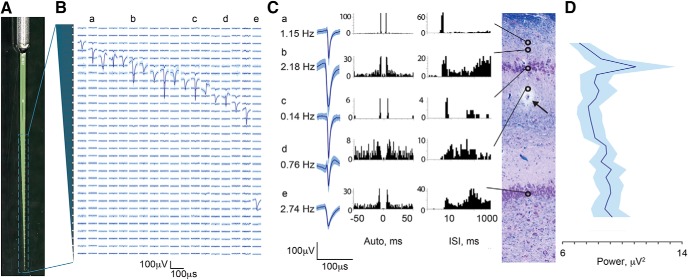
Single units recorded with silicon laminar probes confirm laminar structure. A, Photograph of the custom-made Edge silicon probe shows an internal reference and linear orientation of its 31 channels. In each animal, this probe was inserted into the dorsal hippocampus based on initial electrophysiological mapping. Electrical activity (B–D) is shown as recorded from the final position of the probe. B, Example in one animal of the laminar profile of single-unit activity shown as averaged waveforms (mean ± SD) aligned to the 31 recording channels of the silicon probe along the vertical axis (200 μm spacing), indicated by the gray cartoon of the probe on the left. Lowercase labels (a–e) indicate single-unit examples displayed in C. C, A coronal section of the dorsal hippocampus stained with LFB/CV is shown from the same animal (scale bar = 100 μm). Arrow points to silicon probe artifact, at approximately midshaft. Open circles indicate channels on which single spiking units were isolated revealing a large cluster in the region of stratum pyramidale and a single channel in the region of stratum granulosum (scale bar: x-axis, 2 ms; y-axis, 100 μV). Examples of isolated spike displayed as averaged waveforms (mean ± SD) are shown along with autocorrelograms and interspike intervals histograms (Robertson et al., 2014). Alignment of single-unit examples to the histology was based on recovered artifact of the probe tip (not shown), stereotactic coordinates used during insertion, and known spacing of the 31 contacts. Vertical alignment is only approximate, as the plane of insertion was oblique to the histologic coronal plane and the relative thicknesses of the hippocampal layers change along the AP axis. D, Stratum pyramidale of CA1 was identified in four animals recorded with the Edge laminar silicon probe based on the maximum power of multiunit spiking activity (RMS power in the 600–6000-Hz band; mean ± SEM, n = 4). The traces from all four animals aligned at the peak of the RMS power are shown. Only aligned channels where all four animals overlapped are included (total channels displayed = 25 out of 31).

