
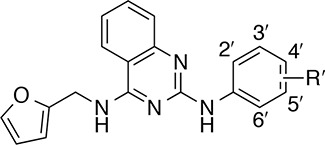
Table 1. SAR of the Aniline Ringa.
| Compd | R′ | EC50 (μM)b | Rel. Act. (%)c |
|---|---|---|---|
| 1 | 3′-Cl | 9.7 ± 1.16 | 96 ± 13.9 |
| 2 | H | — | 47 ± 13.6 |
| 3 | 3′-Me | 16.4 ± 0.35 | 96 ± 2.1 |
| 4 | 3′-Br | 7.1 ± 1.93 | 87 ± 12.5 |
| 5 | 3′-OMe | — | 38 ± 8.5 |
| 6 | 3′-(1-hydroxyethyl) | — | 10 ± 4.8 |
| 7 | 4′-Me | — | 8 ± 1.4 |
| 8 | 4′-Br | — | 16 ± 4.0 |
| 9 | 4′-OMe | — | 19 ± 0.9 |
| 10 | 3′,4′-diMe | — | 37 ± 11.3 |
| 11 | 3′,5′-diMe | — | 44 ± 20.4 |
| 12 | 3′,4′-diCl | — | 22 ± 5.6 |
| 13 | 3′,5′-diCl | — | 41 ± 26.5 |
| 14 | 3′-Cl-4′-F | 13.1 ± 1.20 | 96 ± 10.6 |
a
Each value represents the mean ± SD of at least two separate experiments.
b
“—” denotes an EC50 value of >100 μM or an EC50 value that was not calculated due to low efficacy in vitro.