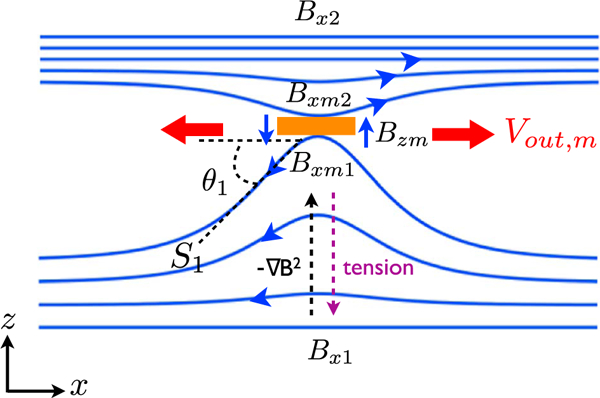
Figure 1.

The geometry of magnetic fields upstream of the diffusion region for asymmetric reconnection. The orange box marks the diffusion region. <DI>S1 = tan|𝜃1|10, </DI> | marks the slope of the magnetic field line on side 1. The strength of the magnetic field is illustrated by the field line density.
