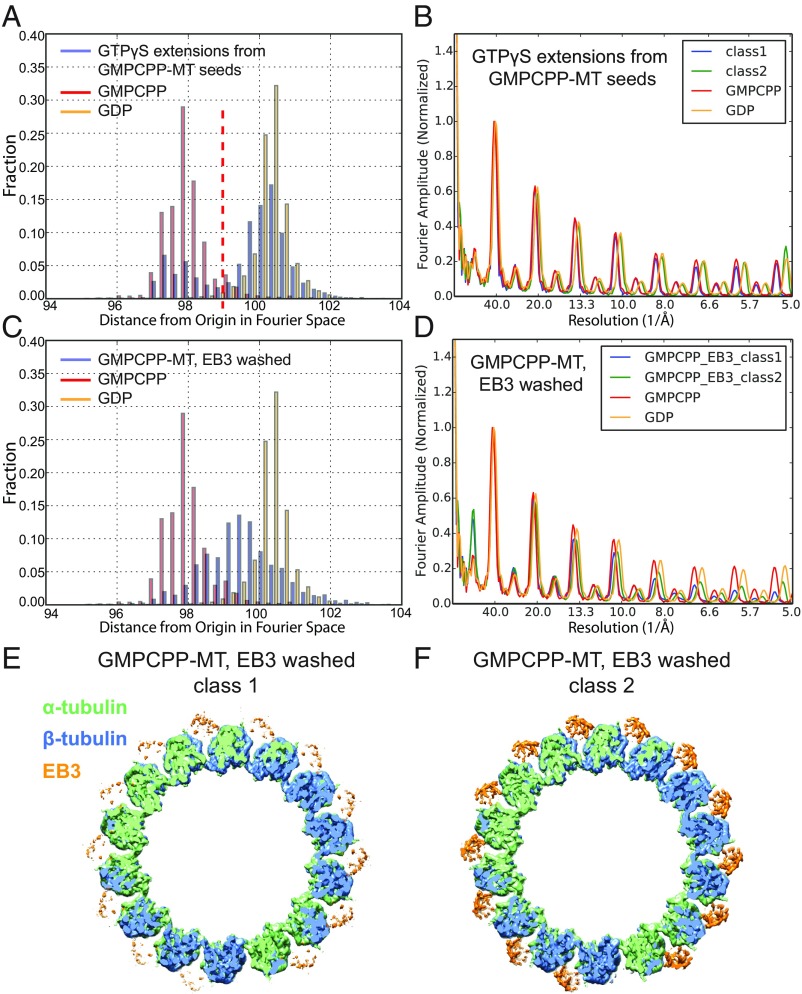
Fig. 4.
Separation of different MT lattice types for samples with a mixed population. (A) Histogram of layer line positions for each MT segment in the dataset of GTPγS growing from GMPCPP-MT seeds, showing a bimodal distribution (only 14-PF MTs are plotted in blue). The x-axis Fourier space unit is arbitrary. The red dashed line indicates the cut-off value we used to separate this dataset into two classes. The histograms of layer line positions for each MT segment in the datasets of the pure undecorated 14-PF GMPCPP-MT (red) and 14-PF GDP-MT (orange) are also shown for comparison (same for C). (B) Plot of layer line profiles for the reconstructions of the two classes observed in the dataset shown in A. The layer line profiles of undecorated GMPCPP- and GDP-MT reconstructions are also shown for comparison (same for D). (C) Histogram of layer line positions for each MT segment in the dataset of EB3 washed GMPCPP-MTs (only 14-PF MTs are plotted in blue). (D) Plot of layer line profiles for the reconstructions of two classes present in the dataset of EB3 washed GMPCPP-MTs (14-PF). (E and F) Top view of the 3D reconstructions of class 1 and class 2, respectively. α-Tubulin, β-tubulin, and EB3 densities are shown in green, blue, and orange, respectively.

