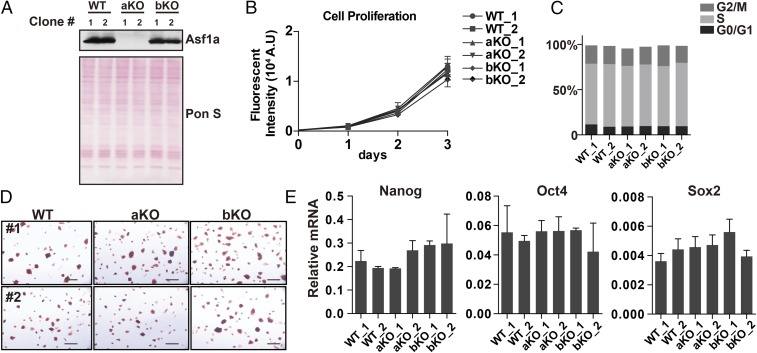
Fig. 1.
Asf1a or Asf1b KO does not affect mouse ES cell growth and identity. (A) Western blot analysis of Asf1a levels (Top) in two independent WT, Asf1a KO (aKO), and Asf1b KO (bKO) ES cell clones (generated by different sgRNAs). Ponceau S staining (Bottom) was used as a loading control. (B) Growth curves of two independent WT, aKO, and bKO ES cell lines. (C) BrdU/propidium iodide FACS analysis of WT, aKO, and bKO ES cells. The percentage of cells at each stage of the cell cycle was quantified. The original FACS profiles are shown in SI Appendix, Fig. S1C. (D) Representative AP staining images of WT, aKO, and bKO ES cells. (Scale bar: 50 µm.) (E) RT-PCR analysis of the expression of three pluripotent genes (Nanog, Oct4, and Sox2) in two independent WT, aKO, and bKO ES cell lines. The y axis indicates the relative mRNA level to GAPDH. The results are from three independent experiments, and bars represent mean ± SEM.

