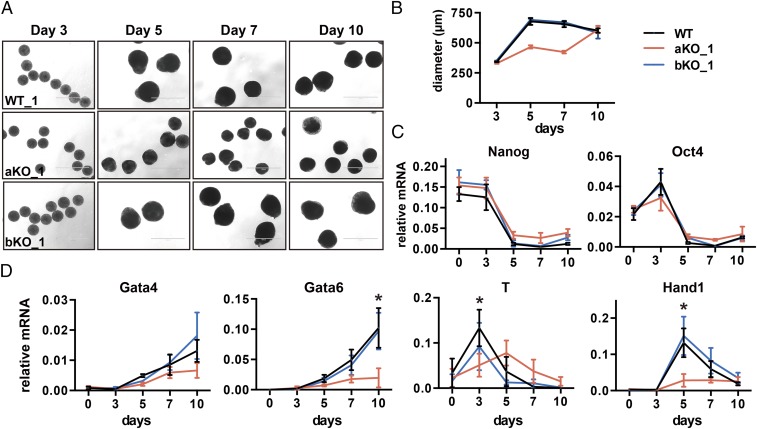
Fig. 2.
Asf1a KO affects expression of lineage-specific genes during ES cell differentiation. (A) Representative images of EB morphology during EB differentiation at days 3, 5, 7, and 10 from WT, aKO, and bKO cells. (Scale bar: 1,000 µm.) (B) The diameter of at least 50 EBs at each time point was measured by using ImageJ. (C and D) RT-PCR analysis of pluripotent (C) and lineage-specific gene (D) expression during ES cell differentiation. Data are from three independent experiments. Error bars represent mean ± SEM. The P value was calculated by using a t test between WT and aKO lines (*P < 0.05). The expression of additional germ-layer genes as well as these genes in another independent clone is shown in SI Appendix, Fig. S3 B and C. Note that the effect of Asf1a deletion on the expression of Gata4, although apparent, was not statistically significant for this set of three repeats. The effect of Asf1a deletion on the expression of Gata4 in the rescue experiments shown in Fig. 5F was statistically significant. The difference between these two sets of experiments likely reflects the fact that Asf1a KO on Gata4 expression is small, and therefore some experimental variations during differentiation can mask the difference.

