Fig. 4.
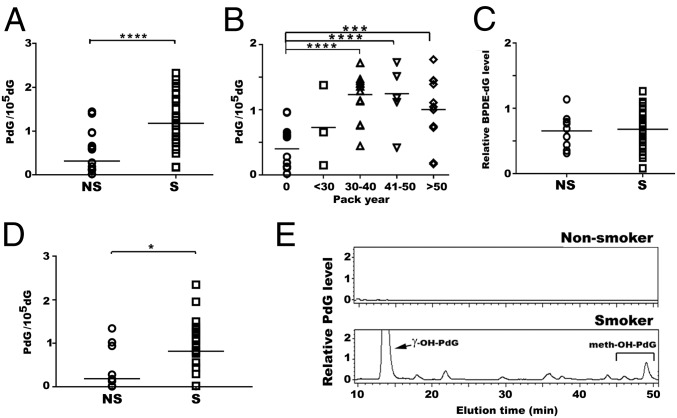
The levels of γ-OH-PdG and α-meth- γ-OH-PdG adducts, but not BPDEdG, were higher in buccal cells of tobacco smokers than nonsmokers. γ-OHPdG, α-meth-γ-OH-PdG, and BPDE-dG in buccal cells of nonsmokers (NS) (n = 17) and smokers (S) (n = 33) with different smoking history (pack-year) were determined by methods described in Figs. 1 and 2. (A) The PdG adducts was detected by the immunochemical methods. (B) The PdG levels in individuals with different smoking history. (C) Relative levels of BPDE-dG in smokers vs. nonsmokers. The PdG adducts in sputum samples of nonsmokers (NS) (n = 8) and smokers (S) (n = 22) with different smoking history were detected by the immunochemical method as described in Fig. 1, and the results were shown in D. (E) HPLC profiles of PdG adduct formed in buccal cells. Genomic DNA from buccal cells of smokers and nonsmokers were pooled for 32P-postlabeling and 2D-TLC/HPLC analysis as in Fig. 1. Note: (i) Due to the limited number of sputum samples collected, the PdG adducts were not analyzed by 32P-postlabeling, 2D-TLC/HPLC. (ii) The ratio of γ-OH-PdG to α-meth-γ-OHPdG detected in buccal cells of smokers is similar to that detected in lung tissues of mice exposed to MTS (8-9:1). ****P < 0.0001, ***P < 0.001, and *P < 0.05.

