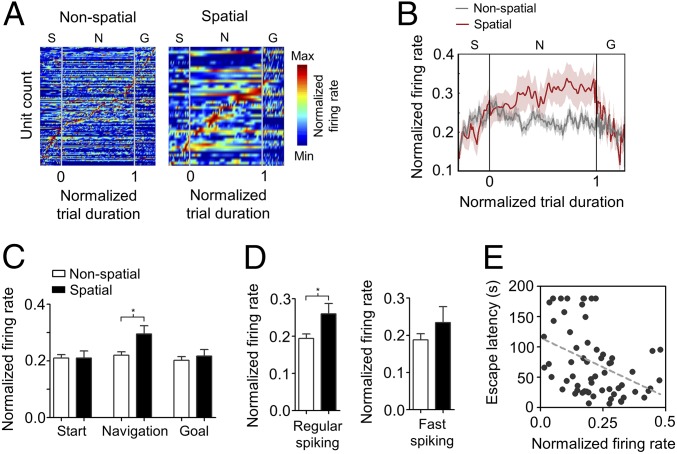
Fig. 4.
Dynamics of prefrontal cortex firing patterns during spatial navigation. (A) Color-coded firing patterns of single units recorded in the prefrontal cortex during nonspatial (Left) and spatial (Right) navigation strategies. Each row represents the color-coded normalized firing rate of one unit (nonspatial, n = 180 units; spatial, n = 47 units) sorted by the timing of peak firing rate. Task-relevant events—navigation onset and escape hole entering—are indicated as points 0.0 and 1.0, respectively. Start (S) and goal (G) phases had fixed durations of 1 min each. The navigation (N) phase varied between 7 and 180 s (median = 57.4 s) but was normalized by number of bins. (B) Temporal evolution of average normalized firing rate during the complete task for nonspatial and spatial navigation strategies. Shaded areas depict SEM. (C) Bar chart of mean normalized firing rates for navigation strategies and phase of the task (*P < 0.05; Mann–Whitney U test). Data are presented as mean ± SEM. (D) Bar chart of mean normalized firing rate between navigation strategies for regular-spiking (Left) and fast-spiking units (Right) (*P < 0.05; Mann–Whitney U test). (E) Correlation between trial-averaged normalized firing rate of regular-spiking units during the navigation phase and trial-averaged escape latency (P = 0.0011; r = −0.165, Spearman correlation analysis).

