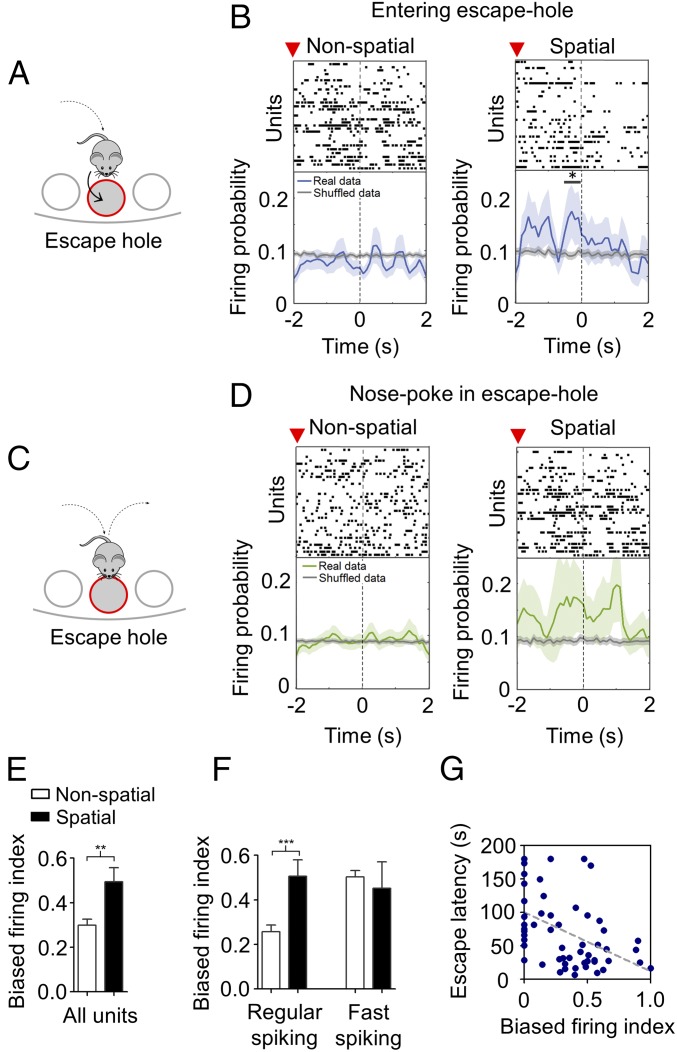
Fig. 5.
Neural representation of task-relevant events in the spike timing of prefrontal units. (A and C) Schematic diagram of task-relevant events: entering (A) or nose poking into (C) the escape hole. (B and D) Example raster plots and average normalized peri-event time histograms of prefrontal units firing during nonspatial and spatial navigation strategies aligned at the time when the mouse either enters (B) or nose pokes into (D) the escape hole. Shuffled data are also displayed (gray line). Superior red arrow indicates time at which mice are at 4 cm from the escape hole. Shading areas indicate SEM (*P < 0.05 with respect to shuffled data, paired Wilcoxon signed-rank test). (E) Bar chart comparing mean biased firing index for the escape hole for all units across navigation strategies (**P < 0.01; Mann–Whitney U test). Data are presented as mean ± SEM. (F) Same as E, but for regular- and fast-spiking units (***P < 0.001; Mann–Whitney U test). Data are presented as mean ± SEM. (G) Correlation between trial-averaged escape latency and trial-averaged biased-firing index of regular-spiking units (P = 0.0044; r = −0.175, Spearman correlation analysis).

