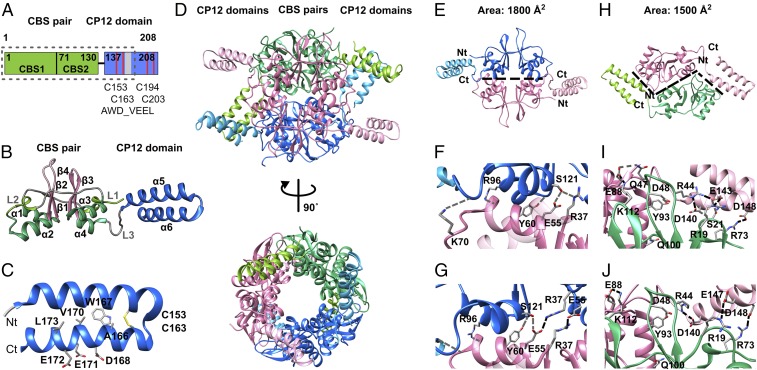
Fig. 2.
Structure and interfaces of hexameric CBS–CP12. (A) Domain organization of CBS–CP12 (IPF_2164) of M. aeruginosa. The dotted box indicates the boundaries of the protein visible in the native crystal structure. The numbering refers to the heterologously expressed protein (SI Appendix, Table S1). (B) Cartoon representation of the monomeric subunit, as obtained from the native orthorhombic crystal structure. The helices in the CBS domain are colored yellow-green (linkers L1 and L2) and green, and the sheets are colored pink. The helices in the CP12 domain are colored blue. The secondary structural elements are sequentially labeled. (C) Cartoon representation of the CP12 domain highlighting the two cysteine residues C153 and C163 and the AWD_VEEL core sequence, as obtained from the native orthorhombic crystal structure. The N and C termini, as visible in the structure, are labeled Nt and Ct, respectively. (D) Cartoon representation of hexameric CBS–CP12 in two different orientations related by a 90° rotation around a vertical axis. The canonical dimers are colored pink, blue, and green, respectively. The respective CP12 domains are colored light pink, light blue, and yellow-green, respectively. (E) Canonical CBS:CBS interface formed by residues in the CBS pairs only. (F and G) Close-up view of the CBS:CBS interface in (F) the native orthorhombic structure showing five hydrogen bonds (gray dashed lines) and (G) the native hexagonal structure showing four hydrogen bonds and two salt bridges (black dashed lines). (H) CBS–CP12:CBS–CP12 interface formed between the CBS pairs and adjacent CP12 domain. (I and J) Close-up view of the CBS–CP12:CBS–CP12 interface in (I) the native orthorhombic structure showing five salt bridges and five hydrogen bonds, formed between the first α-helix of the CP12 domain (α5) and the opposite CBS pair and (J) the native hexagonal structure showing four hydrogen bonds and two salt bridges. Hydrogen bonds (gray dashed lines), salt bridges (black dashed lines), and area are stated as calculated by PISA (25). Numbering of residues refers to the heterologously expressed protein (SI Appendix, Table S1).

