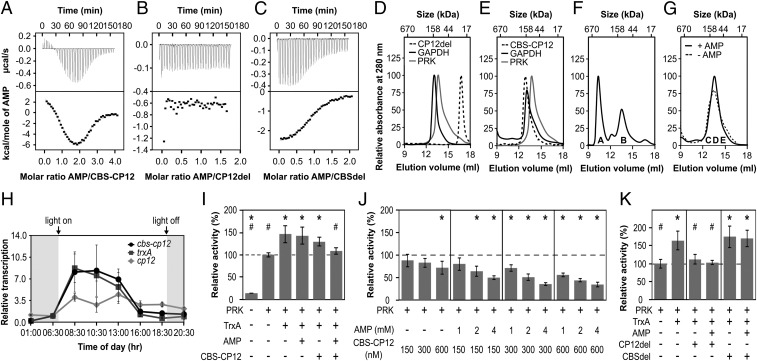
Fig. 3.
Biochemical properties and gene expression of CBS–CP12. (A–C) ITC titration of (A) 400 µM AMP into 20 µM CBS–CP12, (B) 800 µM AMP into 100 µM CP12del, and (C) 700 µM AMP into 70 µM CBSdel. The black lines (Bottom) are the best fit to a two-site model (A) or one-site model (C). Thermodynamic data of three technical replicates are provided in SI Appendix, Table S3. (D and E) Individual S200 SEC elution profiles of (D) CP12del, GAPDH, and PRK and (E) CBS–CP12, PRK, and GAPDH. CP12del elutes at 22.5 ± 0.5 kDa, CBS–CP12 as a hexamer at 143.5 ± 13.6 kDa, PRK at 99.2 ± 7.5 kDa (theoretical monomer size 38 kDa), and GAPDH at 139.2 ± 3.7 kDa (theoretical monomer size 37 kDa) (mean ± SD, n ≥ 2). (F) SEC elution profile of an equimolar mixture (30 µM, subunit base) of GAPDH, PRK, and CP12del with 25 mM DTTox and 0.5 mM NAD. The ternary GAPDH–CP12–PRK complex elutes at ∼569 kDa (peak A). Peak B contains GAPDH and PRK not bound by CP12 (n = 1). (G) SEC elution profile of an equimolar mixture (30 µM, subunit base) of GAPDH, PRK, and CBS–CP12 with 25 mM DTTox, 0.5 mM NAD, ±0.5 mM AMP. GAPDH, PRK, and CBS-CP12 coelute in fraction C-E. (n = 1). (F and G) The denaturing SDS-PAGE of peak A and B and fractions C-E is provided in SI Appendix, Fig. S4K. (H) Diurnal rhythm of the relative transcription of cbs–cp12, trxA, and cp12 in M. aeruginosa (mean ± SD, n = 3). The experiment was repeated twice with consistent results (SI Appendix, Table S4). (I) Relative activity of 300 nM PRK upon addition of 600 nM TrxA, 2 mM AMP, and 300 nM CBS–CP12. (J) Relative activity of 300 nM PRK upon addition of different concentrations of CBS–CP12 and AMP. (K) Relative activity of 300 nM PRK upon addition of 600 nM TrxA, 2 mM AMP, 300 nM CP12del, and 300 nM CBSdel. Data in I–K are mean ± SD, n ≥ 5; *P ≤ 0.01 compared with 300 nM PRK, #P ≤ 0.01 compared with 300 nM PRK + 600 nM TrxA, Student’s t test.

