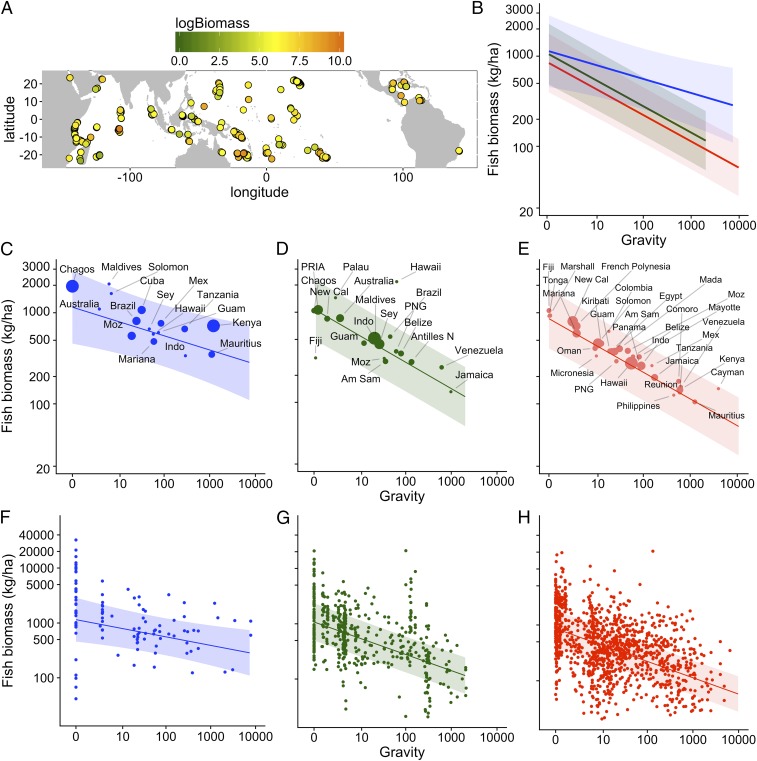
Fig. 2.
Model-predicted relationships between human gravity and reef fish biomass under different types of fisheries management. (A) Map of our study sites with color indicating the amount of fish biomass at each site. (B) Model-predicted relationships of how reef fish biomass declines as gravity increases by management type. Partial plots of the relationship between biomass and gravity under different types of management at the nation/state (C–E), and reef site (F–H) scale; openly fished (red), restricted (green), and high-compliance marine reserves (blue). Shaded areas represent 95% confidence intervals. Bubble size in C–E reflect the number of reef sites in each nation/state, scaled for each management type (such that the largest bubble in each panel represent the highest number of sites per nation/state for that type of management) (SI Appendix, Table S5). Nation/state name abbreviations for F–H are in SI Appendix, Table S5.

