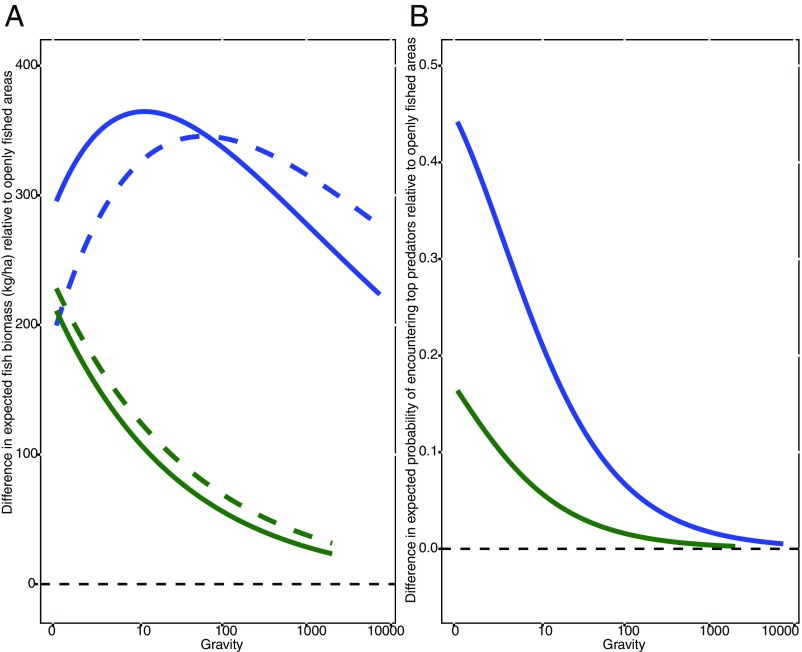
Fig. 4.
The conservation gains (i.e., the difference between openly fished sites and managed areas) for high-compliance marine reserves (blue line) and restricted fishing (green line) for (A) target fish biomass (solid lines include biomass of top predators, dotted lines exclude top predator biomass as per SI Appendix, Fig. S2), and (B) the probability of encountering top predators change along a gradient of gravity.

