Fig. 2.
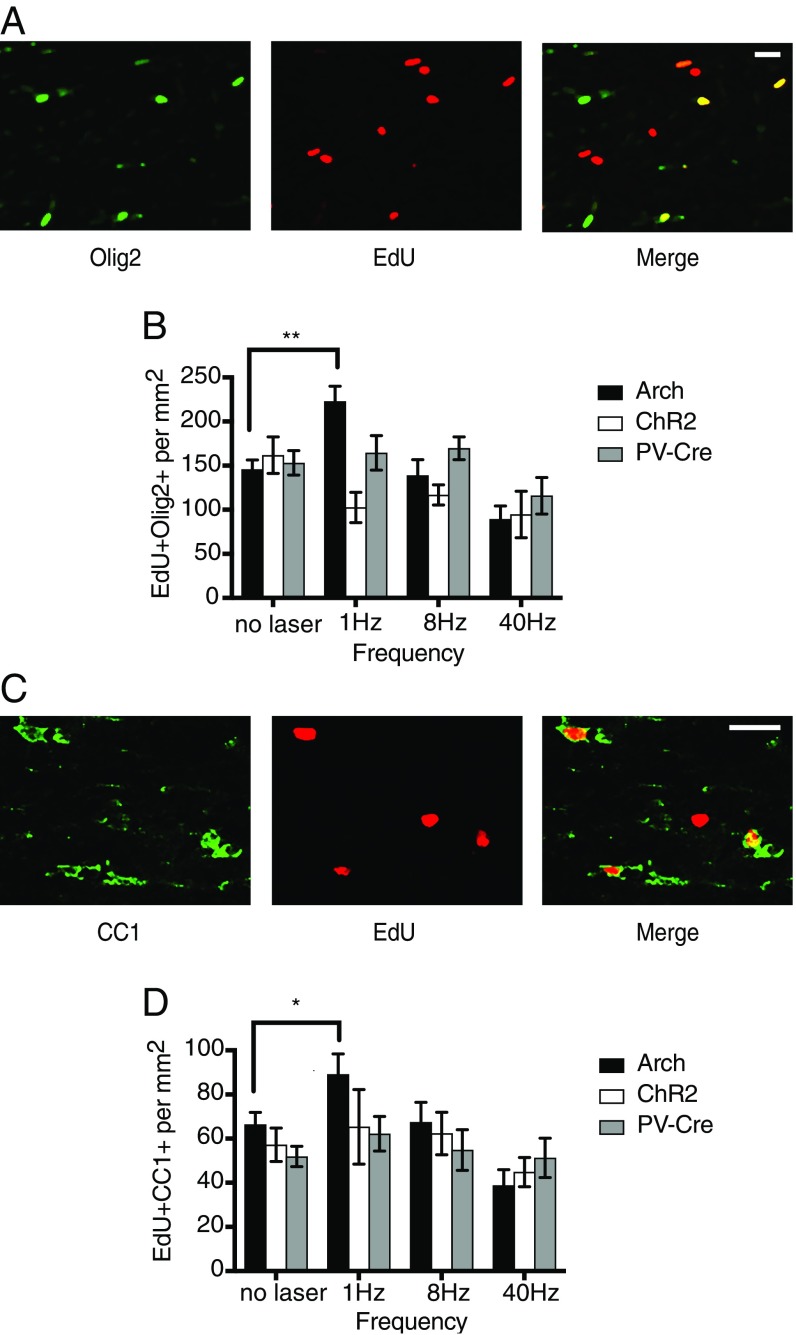
PV-Arch 1-Hz stimulation promotes oligodendrocyte proliferation and differentiation. Effects on cells of the oligodendrocyte lineage to stimulation/inhibition of neuronal activity at different frequencies. (A) Confocal image (20×) of cells in the corpus callosum labeled with an Olig2 antibody to identify cells of the oligodendrocyte lineage (green). Cells that have proliferated during the 4-wk stimulation period are labeled with the thymidine analog EdU (red). Colocalization of EdU and Olig2 (yellow) identifies oligodendrocytes that have proliferated since the beginning of the stimulation protocol. (B) Graph of mean density of proliferating oligodendrocytes (EdU+Olig2+) as a function of frequency for each of the genotypes. (C) Image of cells labeled with CC1 antibody (green) which marks mature oligodendrocytes. EdU+ cells are labeled red. Merge indicates EdU tagged mature oligodendrocytes. (D) Graph of mean density of mature oligodendrocytes (EdU+CC1+) generated over the stimulation period as a function of frequency for each of the genotypes. Error bars indicate SEM. (Scale bars, 20 μM.) *P < 0.05; **P < 0.01.

