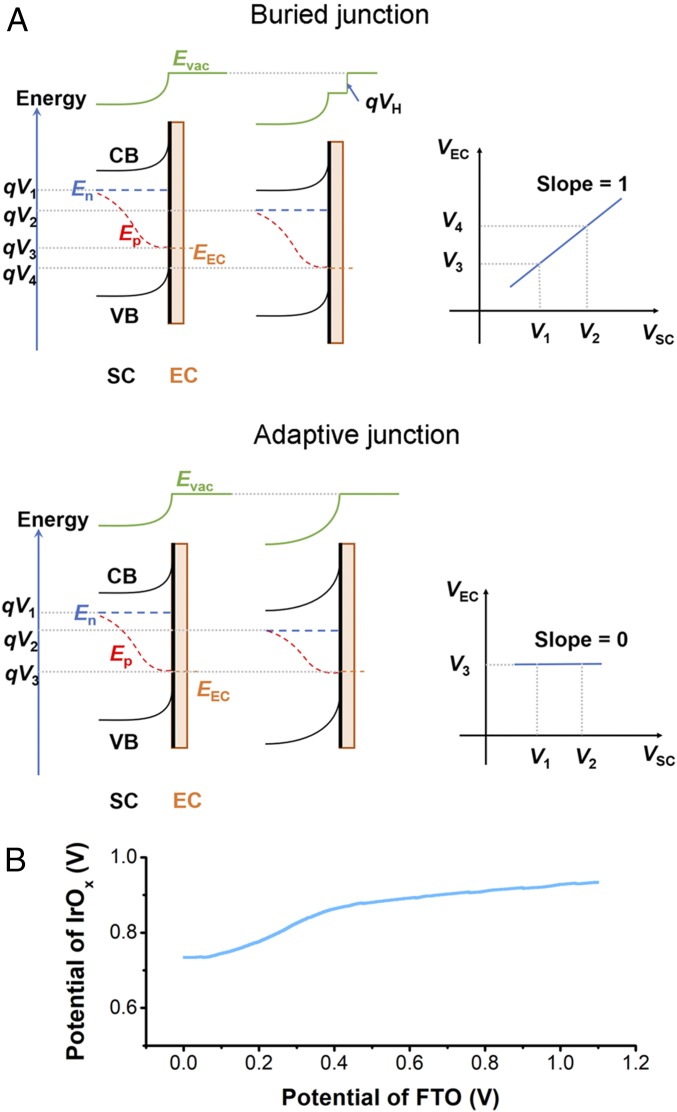
Fig. 5.
(A, Left) Energy diagrams at the SC-EC interface under illumination for a buried and an adaptive junction, including the SC conduction band (CB) and valence band (VB), electron quasi-Fermi level (En), hole quasi-Fermi level (Ep), EC energy level (EEC). (A, Right) electrocatalyst potential (VEC) change as a function of the SC potential (VSC). Note that the applied bias (V1 to V2) in a buried junction drops at the Helmholtz layer (VH) and in an adaptive junction, the applied bias changes band bending. (B) Catalyst potential (VAu vs. Ag/AgCl) recorded during the LSV measurement shown in Fig. 4A (red line) plotted against VFTO.

