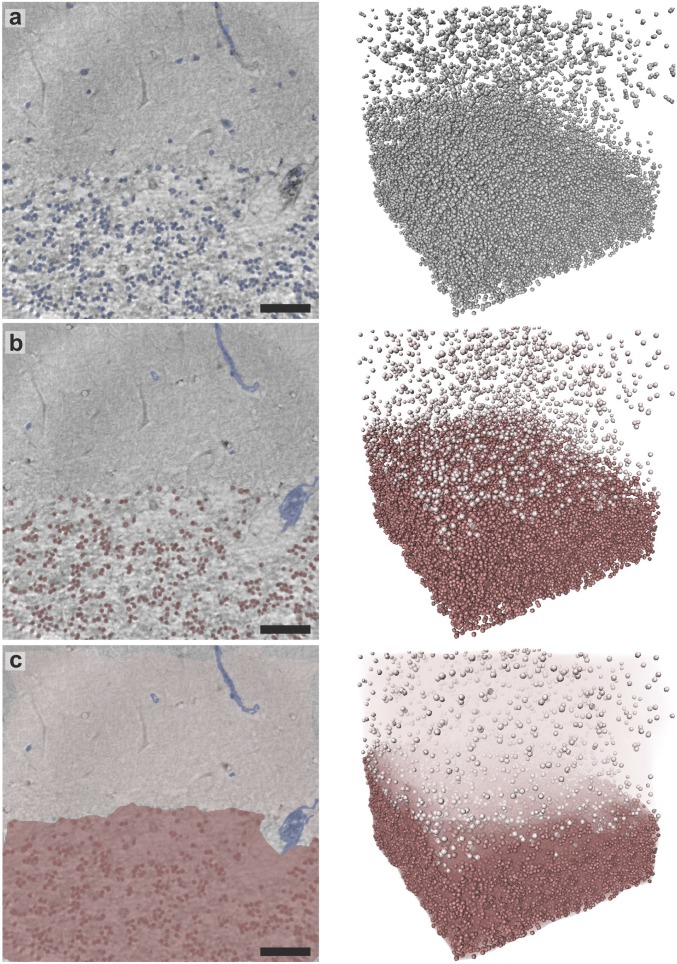
Fig. 3.
Results of the automated segmentation procedure, shown in an exemplary 2D slice through the reconstruction volume as well as in a 3D view. (A) Overlay of all cell nuclei detected by the algorithm (blue). (B) Result after manual removal of blood vessels (blue) and separation into ML (light red) and GL (dark red), based on the mean distance to the 35 nearest neighbors of each cell. (C) Volume estimation for each layer used for determination of the cell densities in the two regions. (Scale bars: 50 m.)

