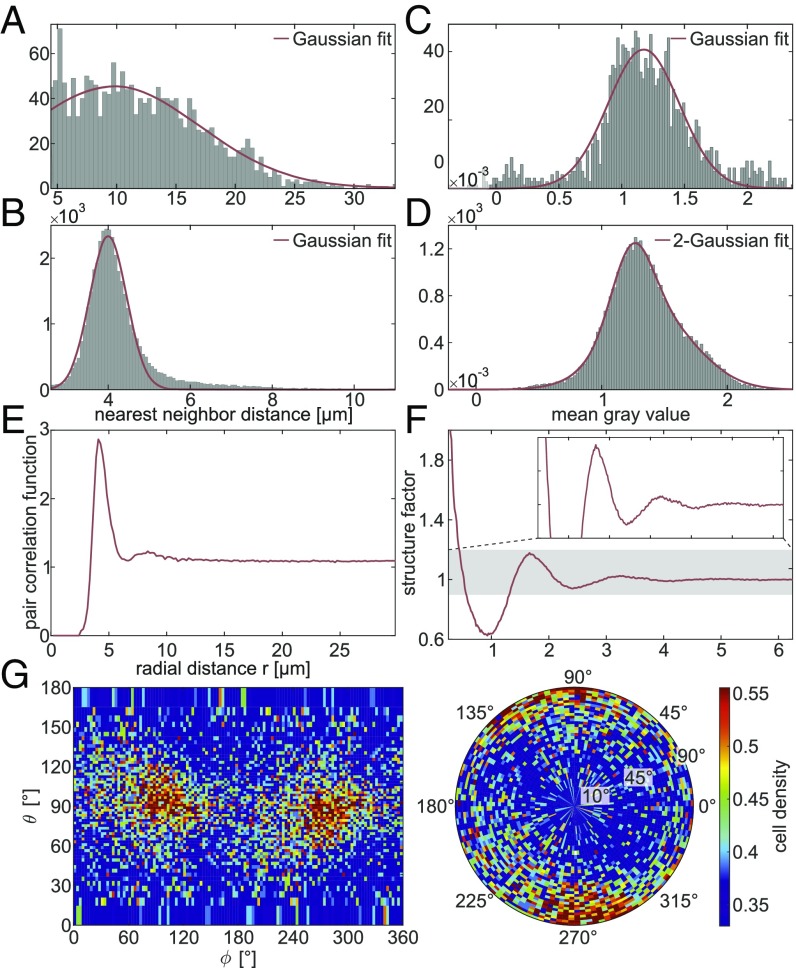
Fig. 4.
Statistical measures obtained from the automatically determined cell positions. (A) Histogram showing the nearest-neighbor distances in the ML. The Gaussian fit reveals a mean nearest-neighbor distance of m (95% confidence interval) with SD m. (B) Histogram of the nearest-neighbor distances in the GL, with a Gaussian fit indicating a mean of m with SD m. (C) Histogram showing the mean gray value within the automatically detected cell volume in the ML. A Gaussian fit leads to with SD . (D) Histogram of the mean gray value in the GL. The shape is best fitted by a 2-Gaussian function with peak values of and and SDs and in an approximate ratio of 30:70. (E) Angular averaged pair correlation function of the cells in the GL revealing two distinct peaks at m and m. (F) Angular averaged structure factor of the cells in the GL. (G) Angular distribution of nearest neighbors in the GL, where corresponds to the plane in which the dendritic tree of the Purkinje cells is spreading and is approximately parallel to the interface between the ML and GL (SI Appendix, SI Methods).

