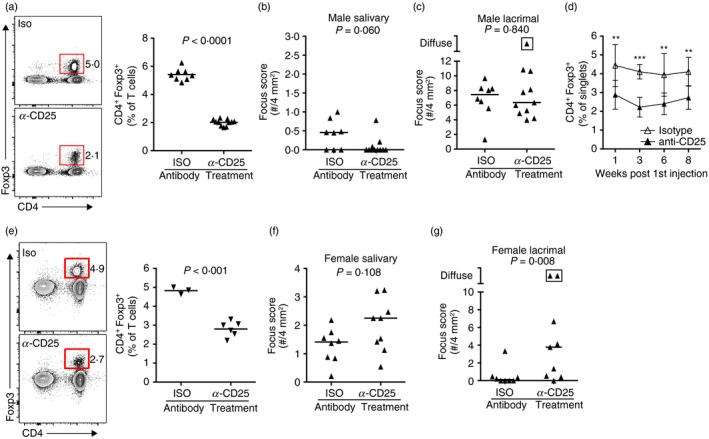
Figure 2.

In vivo regulatory T (Treg) cell depletion results in dacryoadenitis in female non‐obese diabetic (NOD) mice but not sialadenitis in male NOD mice. (a) Representative flow cytometry plots of cells isolated from the cervical lymph nodes (LNs) of male NOD mice that received treatment with anti‐CD25 antibody (n = 11) or isotype control antibody (n = 8) for four consecutive weeks starting at week 0. Plots were gated on singlet T cells (CD3ε +). Graphs depict cumulative quantification of data from two independent experiments. Symbols represent individual mice, bars represent means. P‐value determined by unpaired Student's t‐test. (b, c) Quantification of sialadenitis (b) or dacryoadenitis (c) in male mice from (a). Each data‐point represents an individual mouse and lines represent medians. P‐values determined by Mann–Whitney U‐test. Boxed symbol represents diffuse inflammation in which foci coalesced and could not be accurately enumerated. (d) Cumulative quantification of the percentage of CD4+ Foxp3+ Treg cells present in the peripheral blood of mice from (a) to (c) at the indicated time following the initial antibody treatment. Data are pooled from two independent experiments. Symbols represent means and bars represent the standard deviations. P‐value determined by multiple t‐tests with correction for multiple comparisons using the Holm–Sidak method. **P < 0·01, ***P < 0·001. (e) Representative flow cytometry plots of cells isolated from the cervical LNs of female NOD mice that received treatment with anti‐CD25 antibody or isotype control antibody for four consecutive weeks starting at week 0. Plots were gated on singlet T cells (CD3ε +). Graphs show data from one experiment (anti‐CD25: n = 6; isotype: n = 3). Symbols represent individual mice, bars represent means. P‐value determined by unpaired Student's t‐test. (f and g) Quantification of sialadenitis (f) or dacryoadenitis (g) in female NOD mice treated with anti‐CD25 antibody (n = 9) or isotype control antibody (n = 8). Each data‐point represents an individual mouse and lines represent medians pooled from two independent experiments. Boxed symbols as in (c). P‐values determined by Mann–Whitney U‐test.
