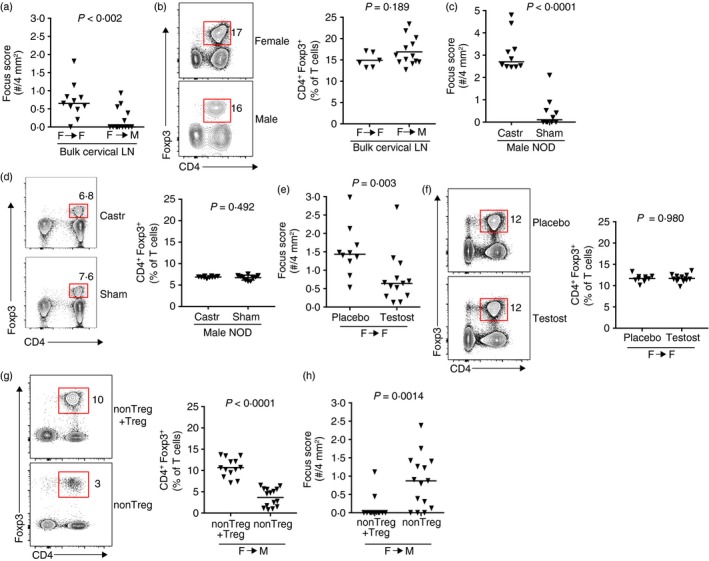
Figure 5.

Female salivary gland‐protective regulatory T (Treg) cells prevent sialadenitis in male mice. (a) Quantification of inflammation of salivary glands in female (n = 11) or male (n = 14) non‐obese diabetic–severe combined immunodeficient (NOD‐SCID) recipients of female bulk cervical lymph node (LN) cells. Data are pooled from two or three independent experiments, respectively. Each data‐point represents an individual mouse and lines represent medians. P‐value determined by Mann–Whitney U‐test. (b) Representative flow cytometry plots of cells isolated from the cervical LNs of recipients in (a). Plots were gated on singlet T cells (CD19− TCR β + or B220− CD3ε +). Numbers indicate the percentage of cells within each gate. Graph depicts cumulative data from one (Female) or two (Male) independent experiments. Symbols represent individual mice, lines are means. P‐value determined by unpaired Student's t‐test. (c) Quantification of inflammation in salivary glands from 15‐week‐old castrated (n = 10) or sham‐castrated (n = 10) male NOD mice. Symbols represent individual mice pooled from two independent experiments. Lines are medians. P‐value by Mann–Whitney U‐test. (d) Representative flow cytometry plots of cells isolated from castrated or sham‐castrated male NOD mice in (c). Plots were gated on singlet T cells (CD19− CD3ε +). Numbers indicate the percentage of cells within the indicated Treg cell gate. Graph depicts cumulative data pooled from two independent experiments. P‐value by unpaired Student's t‐test. (e) Quantification of inflammation in salivary glands from female NOD‐SCID recipients of female NOD cervical LN cells. Recipients were treated with testosterone (n = 13) or placebo (n = 10) before cell transfer. Data are pooled from two independent experiments. Each data‐point represents an individual mouse and lines represent medians. P‐value determined by Mann–Whitney U‐test. (f) Representative flow cytometry plots of cells isolated from recipient mice in (e). Plots were gated on singlet T cells (B220− CD3ε +). Numbers indicate the percentage of cells within each gate. Graph depicts cumulative data from two independent experiments. Symbols represent individual mice, lines are means. P‐value determined by unpaired Student's t‐test. (g) Representative flow cytometry plots of cells isolated from the cervical LNs of male NOD‐SCID recipients of female non‐Treg + Treg cells (n = 13) or non‐Treg cells (n = 15). Plots were gated on singlet T cells (CD19− CD3ε + or CD19− TCR β +). Numbers indicate the percentage of cells within each gate. Graph depicts cumulative data from two independent experiments. Symbols represent individual mice, lines are means. P‐value determined by unpaired Student's t‐test. (h) Quantification of sialadenitis in male NOD‐SCID recipients in (g). Data are pooled from two independent experiments. Each data‐point represents an individual mouse and lines represent medians. P‐values determined by Mann–Whitney U‐test.
