Figure 1.

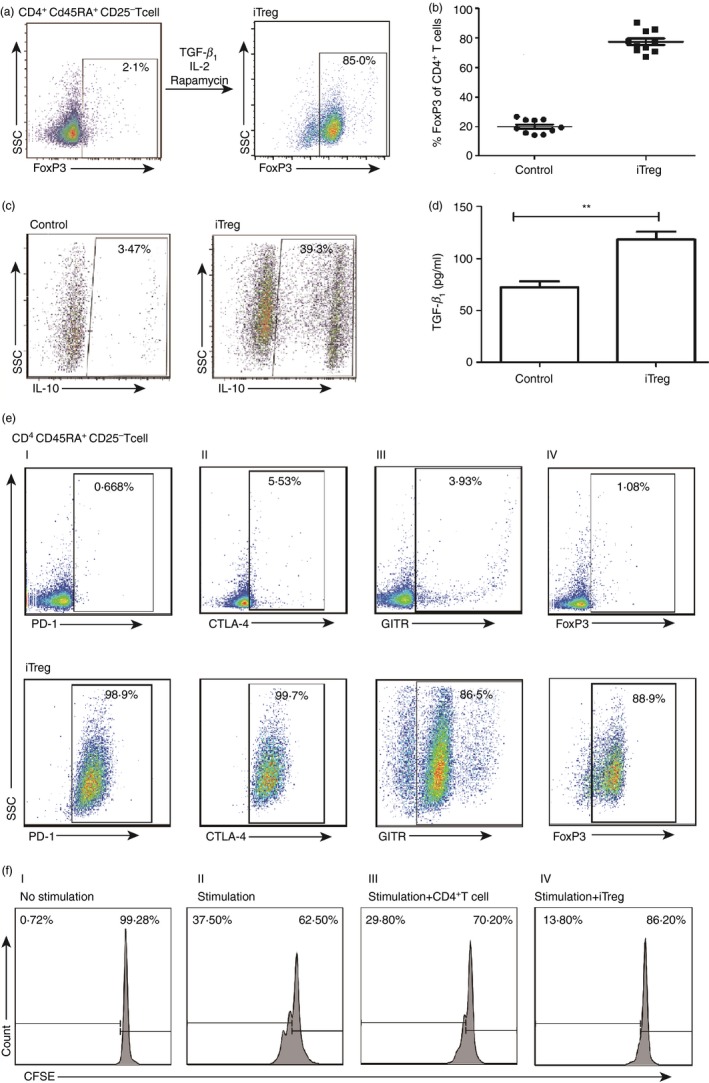
Induction and characterization of human induced regulatory T (iTreg) cells. (a) A representative flow plot to show the induction conditions of the iTreg cells. The CD45RA + CD4+ CD25− T cells, stimulated with anti‐CD3/CD28 monoclonal antibody beads at the cell to bead ratio of 3 : 1, were cultured with the ‘induction cocktail’ (IC). The Foxhead box protein 3 (FoxP3) expression was assessed at day 5 by FACS. (b) FoxP3 expression by the iTreg cells and control cells from 10 different healthy donors. Scattered dot plots depict the percentages of FoxP3 expression in cells treated with IC or without IC (n = 10), each symbol represents one donor. (c) The interleukin‐10 (IL‐10) expression by the iTreg cells. The iTregs and control cells were assessed for secretion of IL‐10 by FACS. (d) The transforming growth factor‐β 1 (TGF‐β 1) secretion by the iTreg cells. The secretion of TGF‐β 1 by the iTreg cells and control cells was detected by ELISA after culturing in AIM medium for 48 hr. Unpaired two‐tailed t‐test, **P < 0·01. (e) Expression of inhibitory markers by the iTreg cells. The expression of inhibitory markers by the iTreg cells was assessed by FACS (lower panel), for programmed cell death protein 1 (PD‐1) (I), cytotoxic T‐lymphocyte associated protein 4 (CTLA‐4) (II), glucocorticoid‐induced tumour necrosis factor receptor (GITR) (III) and FoxP3 (IV), respectively. CD45RA + CD4+ CD25− T cells without induction were used as negative control (upper panel). (f) Suppression of CD8+ T‐cell proliferation by the iTreg cells. The in vitro suppressive activity of the iTreg cells was measured by mixing CFSE‐labelled peripheral blood mononuclear cells (PBMCs) with the iTreg cells, using ratios of PBMC : anti‐CD3/CD28 beads of 3 : 1 and iTreg/CD4+ T cells : PBMC of 1 : 4. After culturing for 3 days, the CFSE dilution was measured by FACS for the determination of CD8+ T‐cell proliferation.
