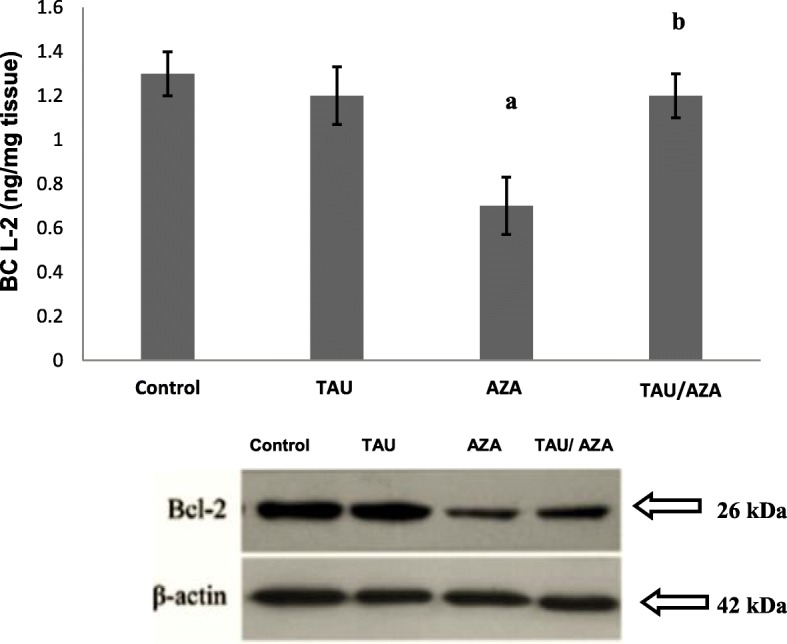
Fig. 4.

Effects of TAU, AZA, and their combination on Bcl-2 expression measured by western blot, β-actin was used as a loading control (C). Data are presented as the mean ± SEM (n = 10). (a) significant difference compared to the control group, (b) significant difference compared to the AZA group, all at P < 0.05
