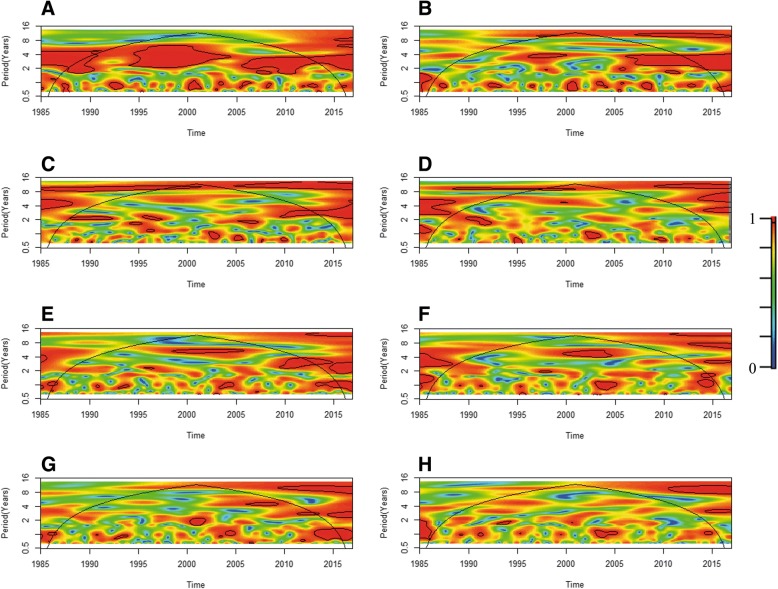
Fig. 6.
Cross wavelet coherence analysis for monthly time series (1985–2016). Panels show the cross-wavelet coherence between: (a) The El Niño Southern Oscillation (ENSO) and temperature. b ENSO and rainfall. c ENSO and number of cattle rabies outbreaks. d ENSO and cattle rabies outbreak mortality. e Temperature and cattle rabies outbreaks. f Temperature and cattle rabies outbreak mortality. g Rainfall and cattle rabies outbreaks (h) Rainfall and cattle rabies outbreak mortality. A cross wavelet coherence scale is presented at the right side of the figure, which goes from zero (blue) to one (red). Red regions in the plots indicate frequencies and times for which the two series share power (i.e., variability). The cone of influence (within which results are not influenced by the edges of the data) and the significant coherent time-frequency regions (p < 0.05) are indicated by black solid lines

