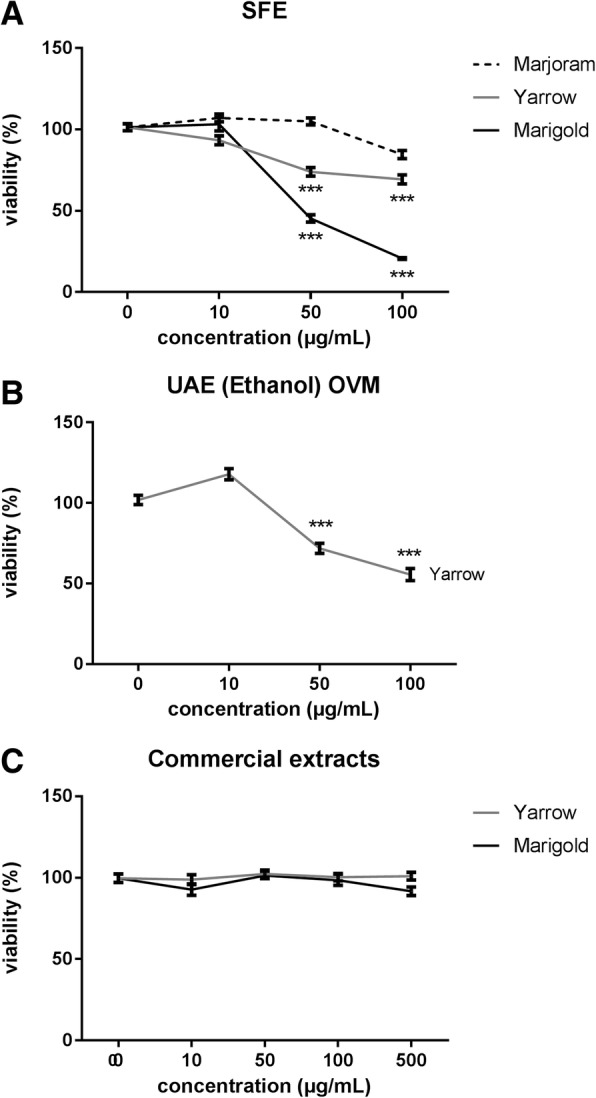
Fig. 3.

Dose-response curves of cell viability assays after 48 h treatment of PANC-1 pancreatic cancer cells with increasing concentrations of SFE extracts (a), UAE (Ethanol) MVO extracts (b) and commercial extracts (c) for PANC-1. Data represent means ± S.E.M of at least three independent experiments each performed in quadruplicate. Asterisks indicate statistical differences in treated cells with respect to the control (non-treated cells, DMSO 0.1%). ***p < 0.001
