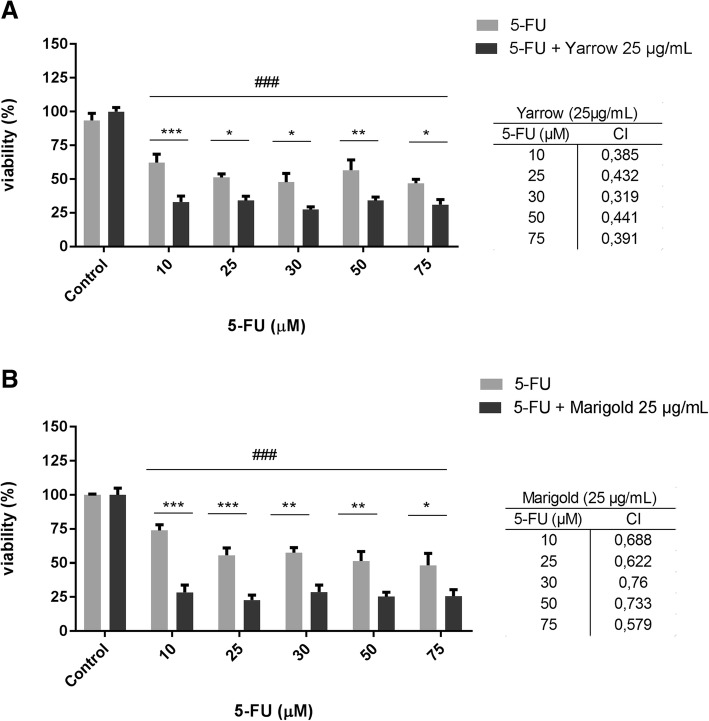
Fig. 6.
MIA PaCa-2 response and Combination Index (CI) when cells were pre-treated 8 h with A) Yarrow or B) Marigold, followed by an exposure of increased doses of 5-FU for 72 h. Data represent means ± S.E.M of at three independent experiments each performed in quadruplicate. Asterisks (*) indicate statistical differences between 5-FU and Yarrow/Marigold+ 5-FU treatments *p < 0.05; **p < 0.01 ***p < 0.001. # indicates statistical differences in treated cells with respect to the control (DMSO 0.1%). ### p < 0.001

