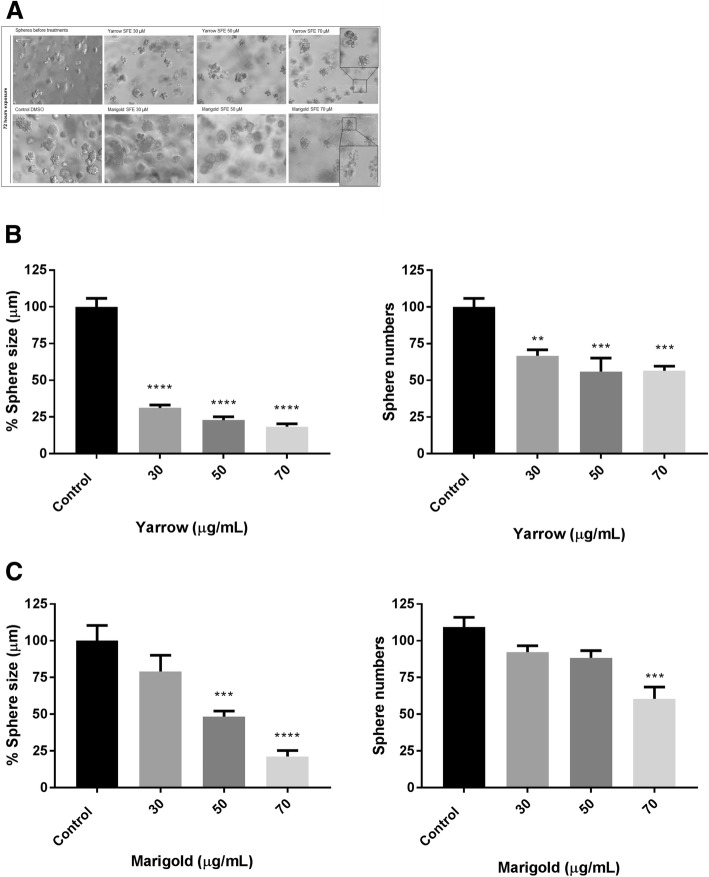
Fig. 7.
Tridimensional MIA PaCa-2 cells when exposed to Asteraceae Extracts. a) Representative images of spheres after Yarrow (up) and Marigold (down) treatments for 72 h. Sphere number, size and morphology after Yarrow (b) and Marigold (c) exposures. Data represent means ± S.E.M of three independent experiments each performed in duplicate. Asterisks indicate statistical differences in treated cells with respect to the control (DMSO, 0.1%) ***p < 0.001; ****p < 0.0001

