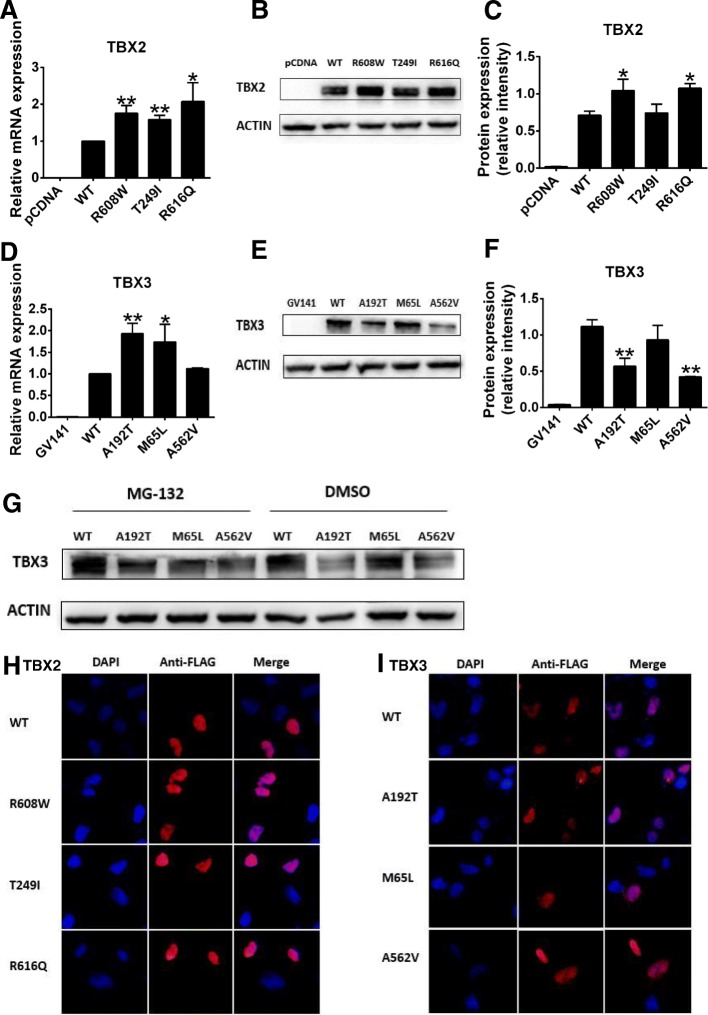
Fig. 4.
mRNA abundance, protein expression level, and subcellular localization of TBX2 and TBX3. Plasmids were transfected into HEK 293T cells and harvested. a, d Relative mRNA expression of the blank vector, wild-type plasmid, and variants of TBX2 and TBX3 (n = 3). GAPDH was used as an internal control. b, e Western blot analysis of the blank vector, wild-type plasmid, and variants of TBX2 and TBX3. Actin was used as an internal control. c, f Density quantitation of TBX2 and TBX3 variant protein expression as shown in b and e (n = 3). g Western blot analysis of TBX3 variant protein degradation through the ubiquitin-proteasome pathway. MG-132 was the proteinase inhibitor and DMSO was used as control. h, i Representative images of immunofluorescence staining of TBX2 and TBX3 variants and wild-type proteins. *P < 0.05, **P < 0.01 versus WT; data represented here are obtained from three biological replicates

