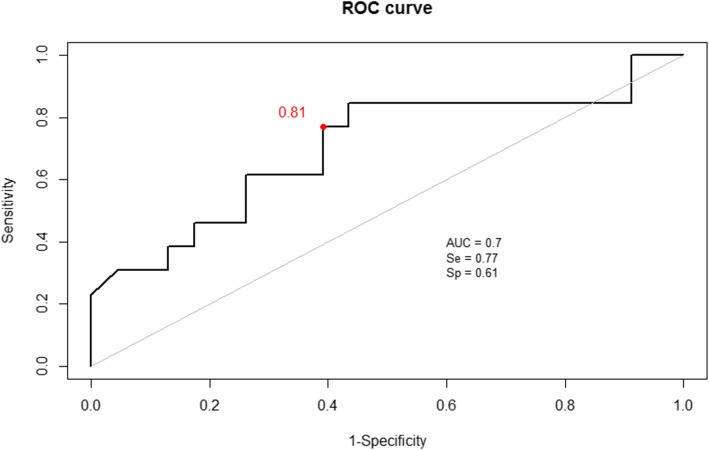
Fig. 1.
ROC curve explaining the risk of presenting with at least one flare during the first 6 months of follow up, with the monosodium urate volume deposited in the feet measured with dual-energy computed tomography. The red dot indicates the volume providing the best discrimination between the group of patients presenting with at least one flare and those without flare. The associated predictive values for this volume are shown. AUC, area under the curve; Sp, specificity; Se, sensitivity

