Fig. 3.

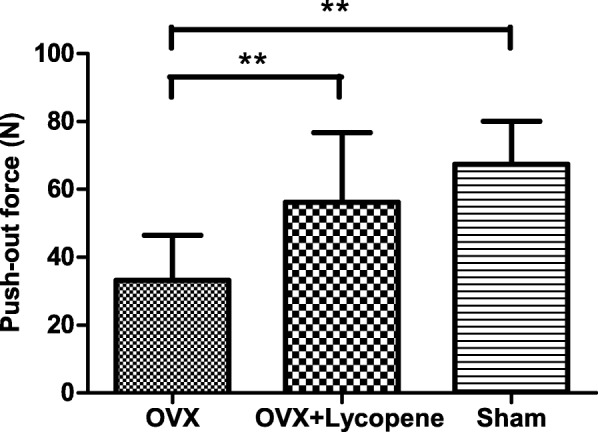
Quantitative result of the biomechanical test of implant fixation presented as the maximal push-out force. Error bars in the figures represent the SD, **p < 0.01 vs. the OVX group

Quantitative result of the biomechanical test of implant fixation presented as the maximal push-out force. Error bars in the figures represent the SD, **p < 0.01 vs. the OVX group