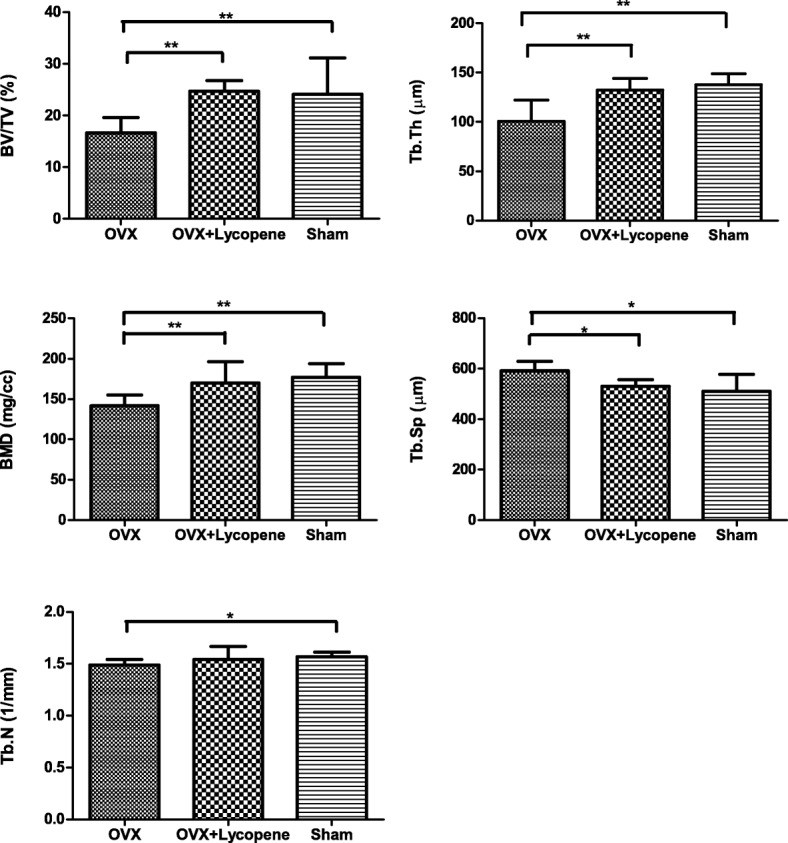
Fig. 5.

Quantitative results of peri-implant bone volume and trabecular micro-architecture by micro-CT analysis. BV/TV, percent bone volume; Tb.Th, mean trabecular thickness; BMD, bone mineral density; Tb.Sp, mean trabecular separation; Tb.N, mean trabecular number. Error bars in the figures represent the SD, *p < 0.05 and **p < 0.01 vs. the OVX group
