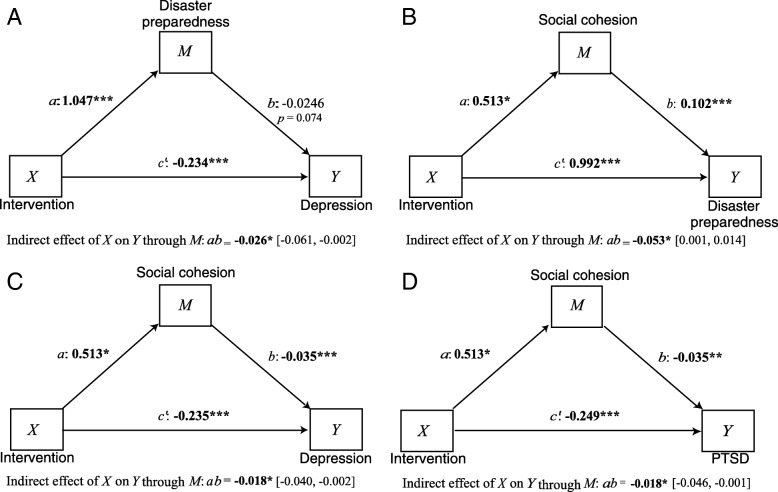
Fig. 2.
Mediation diagrams. a effect of intervention on depression is partially explained by preparedness; (b) effect of intervention on disaster preparedness is partially explained by social cohesion; (c) effect of intervention on depression is partially explained by social cohesion; (d) effect of intervention on PTSD is partially explained by social cohesion. In each model, two equations were used: 1) the effect of the intervention on the mediator (a path), and 2) the effects of the mediator on the outcome variable (b path) and the intervention on the outcome variable (c’ path). The direct effect of the intervention on outcomes is given by c’ and the mediated or indirect effect of the intervention is given by the product ab

